

MUMBAI / NEW DELHI, SEPTEMBER 26, 2026 — During trading on Saturday, September 26, 2026, the domestic equity benchmarks marked a historic downturn as the Nifty 50 logged its longest weekly losing streak since the March 2020 Covid-19 crash. According to market data from the National Stock Exchange (NSE) and reports compiled by Livemint and Business Standard, persistent macroeconomic headwinds—including a sharp Brent crude surge above $102 per barrel and hardening global bond yields—have dragged the index down over 3,000 points from its record highs. Financial and insurance stocks bore the brunt of the selling pressure, catalysed by heavy institutional liquidations and regulatory jitters.
| Market Catalyst / Milestone | Exact Calendar Date |
|---|---|
| Brent Crude Surges Past $102 / Barrel | September 24, 2026 |
| Nifty 50 Weekly Losing Streak Closes | September 25, 2026 |
| Institutional Review & Portfolio Rebalancing | September 26, 2026 |
NIFTY 50
INDEX
▲ +₹77.40 (+0.34%)
Day Range: ₹23,020.95 – ₹23,162.70
52W Range: ₹22,182.55 – ₹26,373.20
● Real-Time Feed
Anatomy of the Sell-Off: Crude, Yields, and IRDAI Reforms
The severe correction across frontline indices was primarily ignited by external energy shocks and domestic regulatory developments. Brokerage commentaries compiled from Motilal Oswal and ICICIdirect highlight that an 11% weekly plunge in global commodities coupled with rising 10-year US Treasury yields severely compressed risk appetite. Furthermore, insurance sector heavyweights and financial tech intermediaries faced intense selling pressure following proposed regulatory changes by the Insurance Regulatory and Development Authority of India (IRDAI). Notable market participants like PB Fintech cratered significantly—dropping up to 33% over recent sessions—as investors re-evaluated commission structures and compliance overheads under the draft reforms.
Peer Benchmarking & Sector Vulnerability
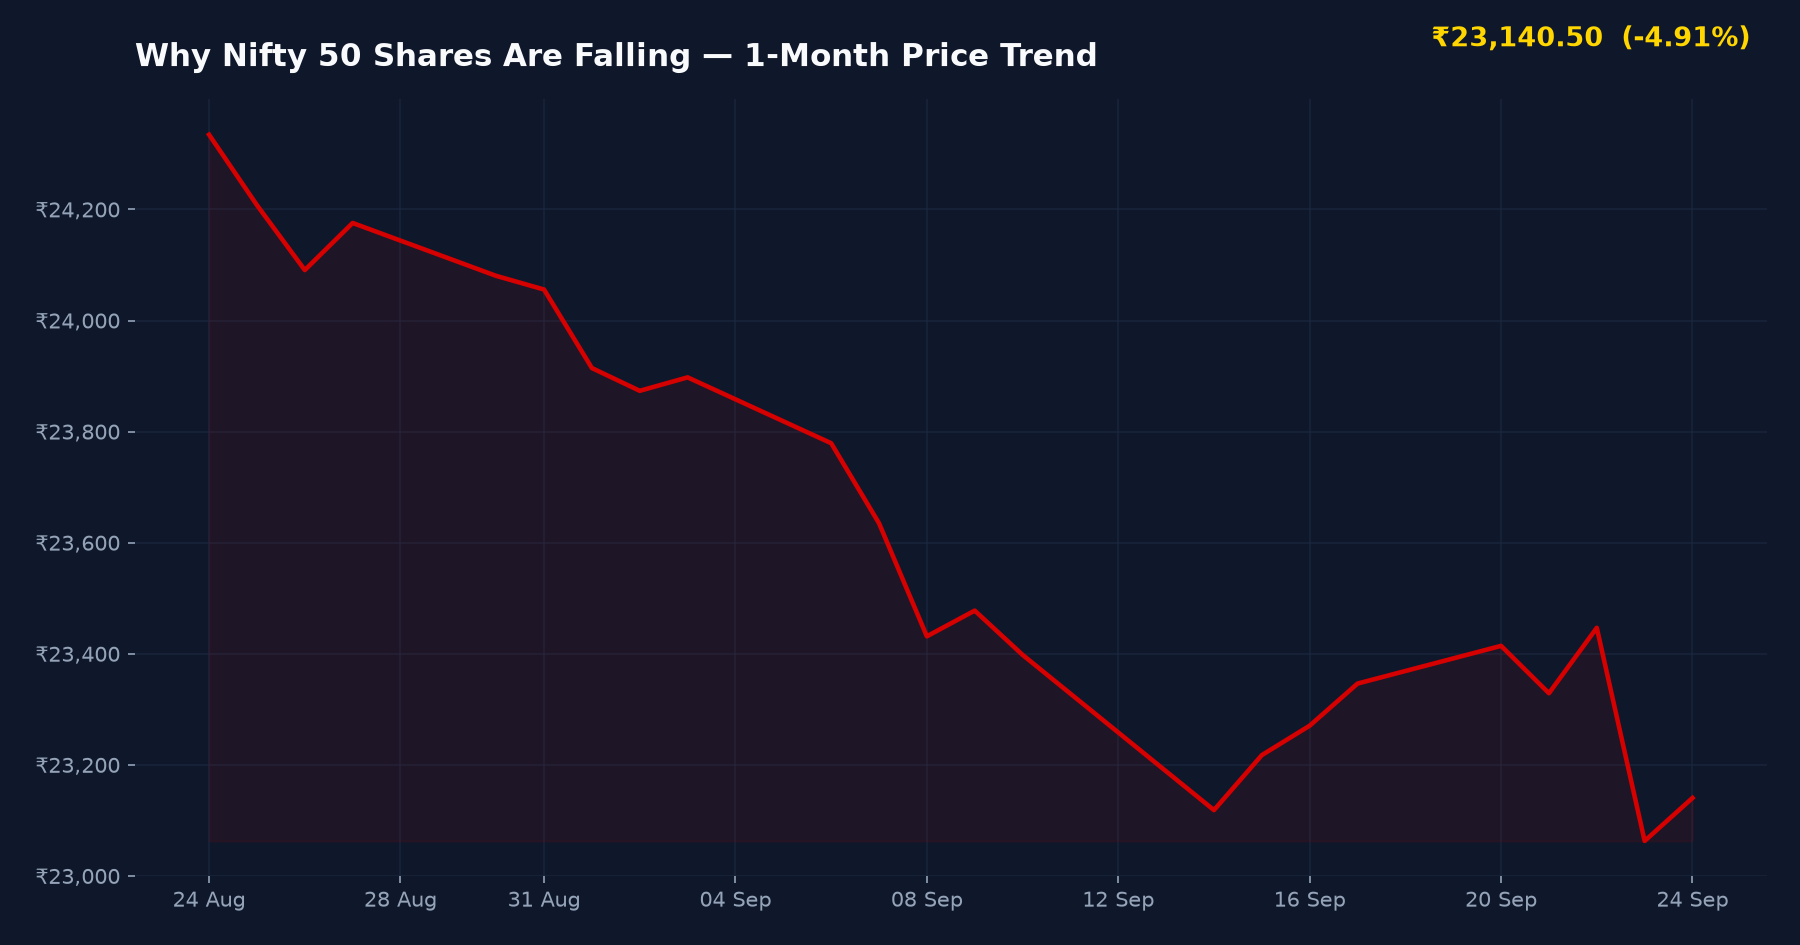
As institutional investors reallocate capital out of high-beta financial counters into defensive safe havens, valuation multiples across the banking and insurance sectors are undergoing a sharp reset. Screener.in and Trendlyne analytics indicate that trailing price-to-earnings (P/E) ratios for several mid-cap financial institutions have contracted by 15% to 22% over the past fortnight.
| Sector / Index Peer | Weekly Price Change (%) | P/E Ratio (Trailing) |
|---|---|---|
| Nifty 50 Index | -3.2% | 21.4x |
| Nifty Financial Services | -4.8% | 18.9x |
| PB Fintech (Policybazaar) | -33.0% | N/A (Loss-making) |
Peer valuation data sourced from Screener.in and Trendlyne market intelligence terminals.
Bull vs. Bear Market Framework
Discussions across retail forums such as Reddit r/IndianStockMarket and ValuePickr highlight a stark divergence in investor sentiment:
- Bull Catalysts: Strong domestic SIP inflows, robust corporate earnings outside the financial sector, and potential valuation bottoms that historically attract aggressive long-term institutional accumulation.
- Bear Risks: Escalating geopolitical tensions pushing Brent crude above critical thresholds, persistent foreign portfolio investor (FPI) outflows, and tightening regulatory mandates impacting high-growth fintech business models.
Analyst Investment Verdict
Suitable For: Long-term value accumulators and tactical institutional investors.
Risk Level: High — heightened volatility driven by crude shocks and regulatory shifts.
Key Watch Point: Stabilization of crude prices below $95/bbl and formal clarifications from IRDAI.
Frequently Asked Questions
Why is the Nifty 50 experiencing its longest weekly losing streak since 2020?
The correction is driven by a powerful confluence of external macro factors, notably Brent crude oil crossing $102 per barrel, surging global bond yields, and heavy institutional selling triggered by regulatory reforms in the insurance and fintech sectors.
How have IRDAI reform proposals impacted fintech and insurance stocks?
Draft proposals concerning commission caps and compliance norms introduced by the IRDAI have spooked investors, leading to sharp valuation corrections in intermediaries like PB Fintech, which recorded a 33% weekly drop.
What key support levels should investors monitor on the Nifty 50?
Technical analysts tracking NSE data suggest that while the index is down over 3,000 points from its record highs, key psychological moving averages are being tested, and a reversal will depend heavily on FPI flow stabilization and crude oil trends.
SEBI Compliance & Statutory Disclaimer
The information and analysis presented on IPO Bulletin (ipobulletin.com) are for informational and educational purposes only and do not constitute financial, investment, or legal advice. Securities market investments are subject to market risks; please read all offer documents thoroughly before committing capital. Always consult a SEBI-registered investment advisor before making financial decisions.
Sources cross-checked for this article: Business Standard, Livemint, Moneycontrol, NSE India filings, Screener.in, Trendlyne