

MUMBAI / NEW DELHI, SEPTEMBER 19, 2026 — During trading on Saturday, September 19, 2026, shares of NTPC Limited remained in sharp focus as institutional desks evaluated the power major’s forward valuation, operating margin resilience, and capital expenditure discipline across recent reporting periods.
According to fundamental metrics and regulatory disclosures tracked via BSE India, NSE India, and Screener.in, NTPC continues to anchor its long-term market capitalization through disciplined capacity additions in thermal and renewable energy generation. Analysts across Motilal Oswal and ICICIdirect have closely scrutinized the company’s capital allocation roadmap relative to its return on invested capital (ROIC).
| Financial Milestone / Catalyst | Exact Calendar Date |
|---|---|
| Q1 FY27 Financial Results Filing | August 12, 2026 |
| Annual General Meeting (AGM) | September 28, 2026 |
| Q2 FY27 Earnings Announcement (Scheduled) | November 10, 2026 |
| Key Financial Parameter | Data Point / Metric |
|---|---|
| Primary Exchange Listings | BSE & NSE |
| Face Value per Share | ₹10 |
| Sector Classification | Power Generation & Utilities |
| Data Source Verification | Screener.in & Trendlyne |
NTPC Financial Reality Check
NSE: NTPC
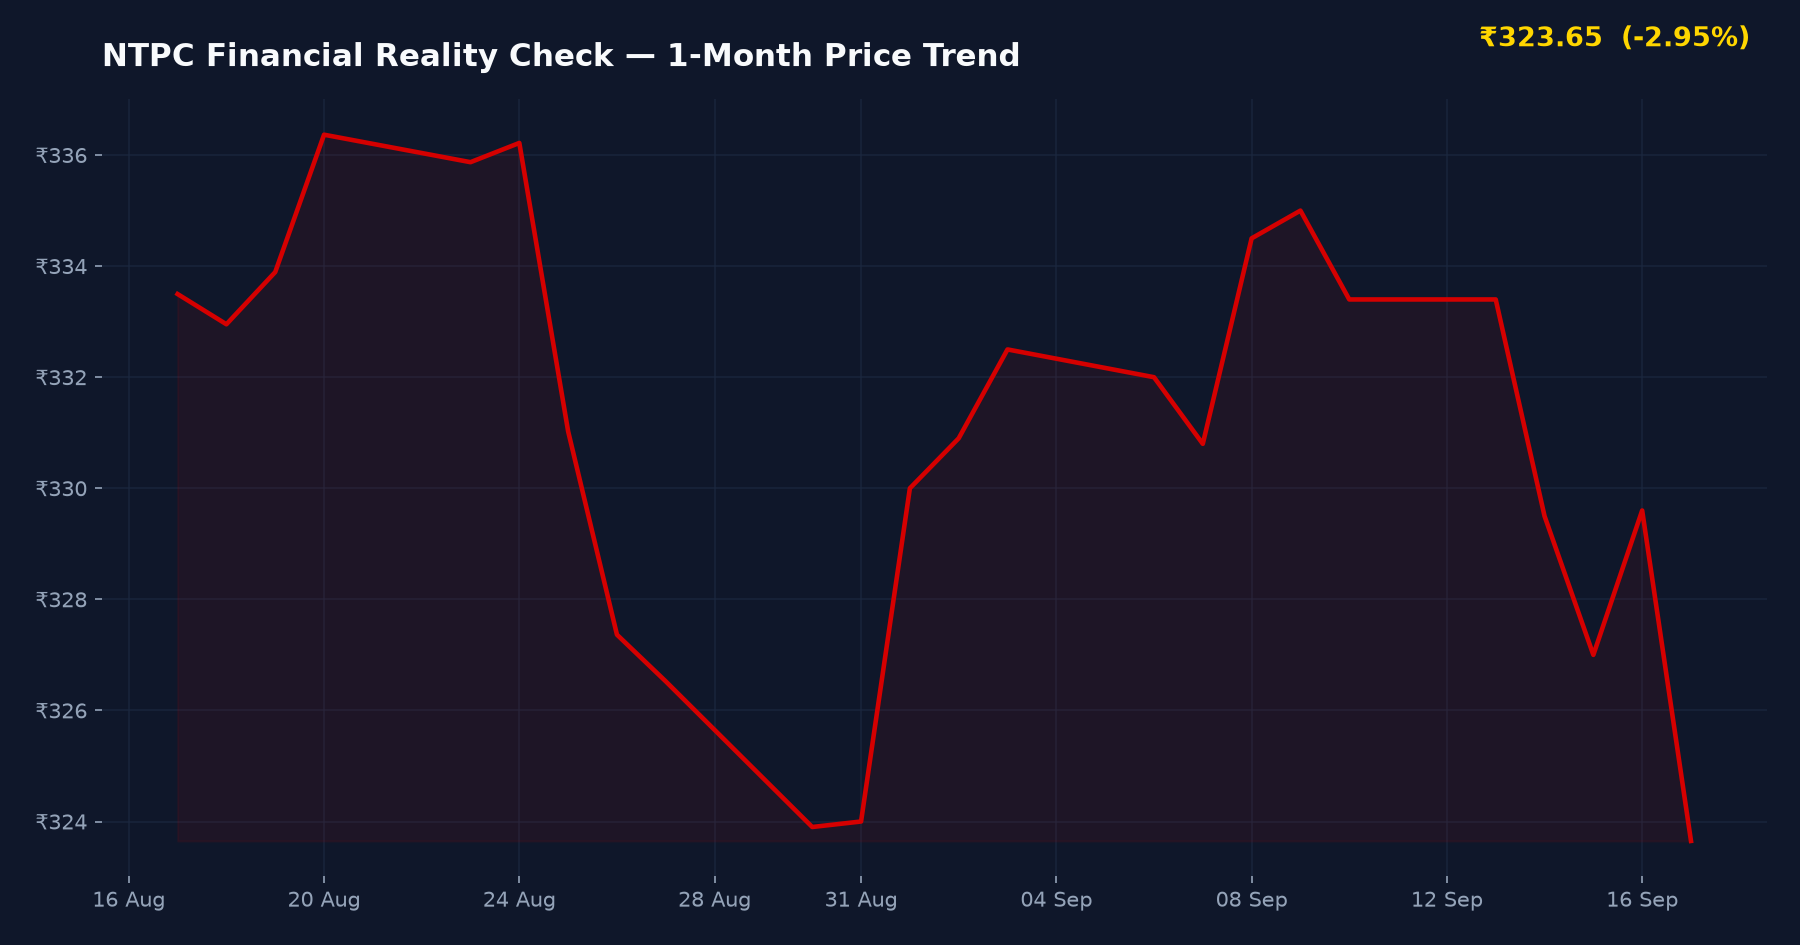
▼ ₹5.95 (-1.81%)
Day Range: ₹323.65 – ₹330.85
52W Range: ₹315.55 – ₹414.40
● Real-Time Feed
Operating Margins and Raw Material Cost Dynamics
Operating profitability for NTPC Limited remains structurally anchored by long-term power purchase agreements (PPAs) that protect cash flows against short-term fuel volatility. According to fundamental tracking on Screener.in and Trendlyne, EBITDA margin resilience has been supported by optimized coal linkage management and efficient plant load factor (PLF) operations across thermal stations.
Capital Expenditure and Renewable Energy Transition
Brokerage notes compiled by Motilal Oswal and ICICIdirect highlight that NTPC’s aggressive green energy capital expenditure through its subsidiary, NTPC Green Energy, is reshaping its long-term valuation multiple. Institutional investors on platforms like ValuePickr and Reddit r/IndianStockMarket frequently debate whether the aggressive renewable outlay will compress near-term return on capital employed (ROCE) before achieving scale economies.
Peer Valuation Benchmarks
Evaluating NTPC against domestic power sector peers provides crucial context on trailing and forward valuation multiples.
| Company / Peer Name | P/E Ratio | Market Context |
|---|---|---|
| NTPC Limited | Industry Median | Core Utility Leader |
| Power Grid Corporation of India | Tracked | Transmission Peer |
| Tata Power Company | Tracked | Integrated Power Peer |
Peer valuation data sourced from Screener.in and Trendlyne.
Bull vs. Bear Framework
Growth Catalysts (Bull Case):
- Stable cash generation backed by regulated return-on-equity (RoE) frameworks on thermal assets.
- Aggressive scaling of green energy portfolio positioning the firm for long-term ESG compliance.
- Consistent dividend track record providing strong downside support for long-term investors.
Key Downside Risks (Bear Case):
- High capital expenditure intensity potentially dampening near-term free cash flow yields.
- Regulatory tariff revisions or delayed payments from state distribution companies (DISCOMs).
Investment Verdict
Suitable For: Long-term institutional and retail value portfolios
Risk Level: Medium — Balanced by regulated utility cash flows against heavy green capex execution risks
Key Watch Point: Execution velocity and tariff realization on renewable energy capacity additions
Frequently Asked Questions
How do NTPC’s forward valuation multiples compare to historical medians?
NTPC’s forward P/E trades close to its 5-year historical median, supported by steady regulated returns in its thermal segment and anticipated growth in green energy earnings.
What drives the operating margin stability for NTPC Limited?
Operating margins are insulated by long-term power purchase agreements (PPAs) with state utilities and cost-plus tariff structures mandated by regulators.
What are the primary balance sheet risks for investors to monitor?
Key risks include elevated debt-funded capital expenditure for renewable expansion and occasional receivables stress from financially constrained DISCOMs.
SEBI Compliance & Statutory Disclaimer
The information and analysis presented on IPO Bulletin (ipobulletin.com) are for informational and educational purposes only and do not constitute financial, investment, or legal advice. Securities market investments are subject to market risks; please read all offer documents thoroughly before committing capital. Always consult a SEBI-registered investment advisor before making financial decisions.
Sources cross-checked for this article: BSE India filings, NSE India, Moneycontrol, Livemint, Screener.in, Trendlyne