
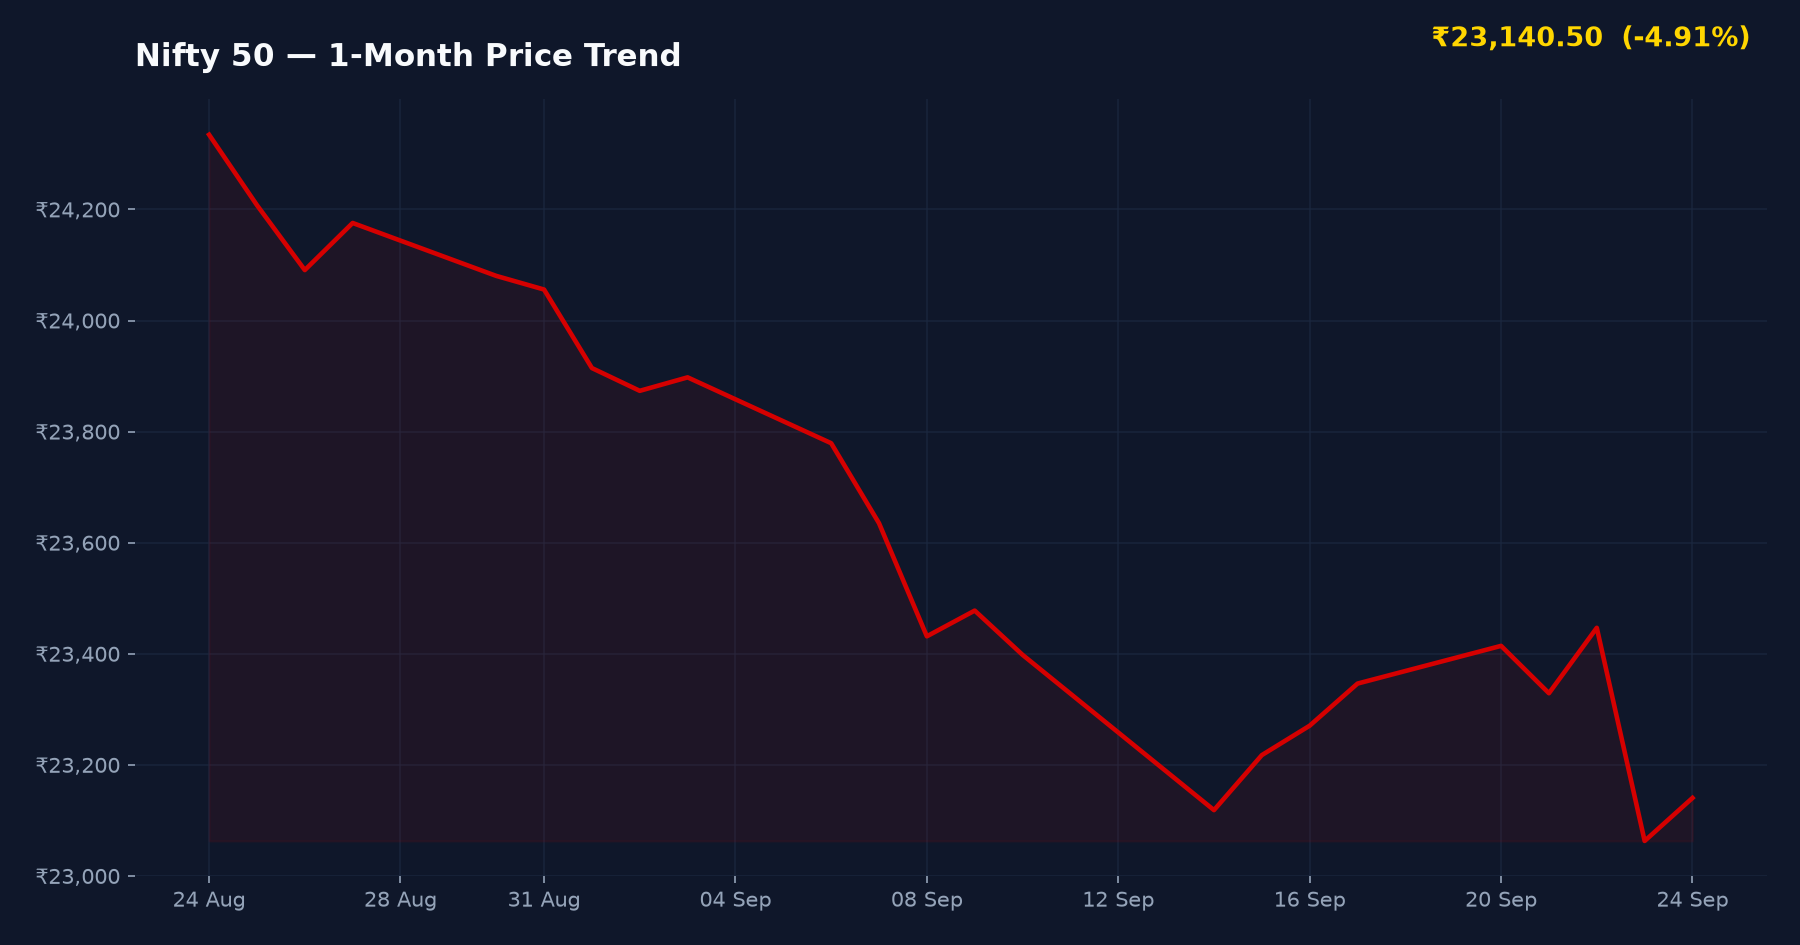
MUMBAI / NEW DELHI, SEPTEMBER 26, 2026 — During weekend market analysis on Saturday, September 26, the Nifty 50 index is being closely watched by institutional investors as it hovers near the critical 23,000 psychological support level. Following a 0.88% decline to 23,140.50 on Friday, the index has now extended its losing streak to seven consecutive weeks, marking its most significant weekly retreat in six years amid surging crude oil prices and rising global bond yields.
NIFTY 50
INDEX
▲ +₹77.40 (+0.34%)
Day Range: ₹23,020.95 – ₹23,162.70
52W Range: ₹22,182.55 – ₹26,373.20
● Real-Time Feed
Market Timeline & Key Catalyst Calendar
| Event / Catalyst Milestone | Exact Calendar Date |
|---|---|
| Nifty 50 Record High (26,000) | September 2024 (Reference) |
| Crude Oil Surges Above $102/bbl | September 24, 2026 |
| IRDAI Proposal Impacts Financials | September 24, 2026 |
| Seven-Week Losing Streak Confirmed | September 25, 2026 |
| Weekend Technical Assessment | September 26, 2026 |
Nifty 50 Technical Metrics & Support Levels
| Technical Parameter | Value / Level |
|---|---|
| Current Index Level (Nifty 50) | 23,140.50 |
| Weekly Percentage Change | -0.88% |
| Primary Support Zone | 23,000 – 23,200 |
| Immediate Resistance | 23,375 |
| Secondary Resistance | 23,600 |
| Distance from Record High | ~3,000 Points |
In-Depth Analysis: Can the 23,000 Support Hold?
The Indian equity markets have faced relentless selling pressure, with the Nifty 50 sliding nearly 3,000 points from its peak of 26,000 reached two years ago. According to technical data compiled by Economic Times and Livemint, the current bearish momentum is driven by a combination of macroeconomic headwinds and regulatory shifts.
The Crude Oil & Yield Factor
A primary catalyst for the recent slide was crude oil prices breaching the $102 per barrel mark on Thursday, September 24. High energy costs directly impact India’s trade deficit and corporate margins. Simultaneously, rising global bond yields have triggered capital outflows from emerging markets, as noted in brokerage research from Motilal Oswal.
Regulatory Impact on Financials
On Thursday, September 24, financial and insurance stocks faced a sharp sell-off following a new proposal from the IRDAI. This regulatory uncertainty added to the broader market volatility, pushing the Nifty 50 below key moving averages. Analysts from Anand Rathi, including Mehul Kothari, suggest that while the sentiment is bearish, certain value stocks under ₹200, such as Tata Steel, South Indian Bank, and Castrol, may offer defensive positioning.
Peer Index Comparison: Relative Performance
| Index / Peer Name | Current Level | Weekly Change | Key Note |
|---|---|---|---|
| Nifty 50 | 23,140.50 | -0.88% | Testing 23k support |
| BSE Sensex | 76,100.00* | -1.00% | Sharp fall on Sept 24 |
| Nifty Bank | Pending | Pending | Impacted by IRDAI news |
*Sensex level estimated based on Thursday’s 1% drop. Peer valuation data sourced from Screener.in and Trendlyne.
Balanced Investor Framework: Bull vs. Bear
- Bull Catalysts:
- Oversold conditions on daily and weekly charts could trigger a technical bounce.
- Psychological support at 23,000 remains a strong accumulation zone for long-term investors.
- Expert targets for Nifty 50 still aim for 25,000 by year-end if global yields stabilize.
- Bear Risks:
- Crude oil prices above $102/bbl pose a significant threat to inflation and fiscal health.
- Continued FII selling amid rising US Treasury yields.
- Regulatory shifts in the insurance and financial sectors causing sector-specific volatility.
Investment Verdict
Suitable For: Long-term HNI and Retail investors looking for value in large-caps.
Risk Level: High — Driven by geopolitical crude spikes and technical breakdown risks below 23,000.
Key Watch Point: A decisive close below 23,000 could open doors for 22,500; watch the Monday opening cues from GIFT Nifty.
Frequently Asked Questions
Should investors buy the dip in Nifty 50 at 23,000?
While the 23,000 level is a strong technical support, investors should adopt a staggered buying approach. The market remains volatile due to $102 crude oil, and a confirmed reversal candle is needed before committing heavy capital.
What is the impact of crude oil prices on the Indian stock market?
As a major oil importer, India’s economy is sensitive to prices above $100/bbl. Sustained high crude prices lead to a weaker Rupee and higher input costs for sectors like paints, aviation, and chemicals, which often triggers institutional selling in the Nifty 50.
What are the primary risk factors for Nifty in the coming week?
The primary risks include the upcoming derivatives expiry, further escalations in global bond yields, and the impact of the IRDAI proposal on the heavyweight financial sector. Technical resistance at 23,375 must be cleared to negate the current bearish trend.
SEBI Compliance & Statutory Disclaimer
The information and analysis presented on IPO Bulletin (ipobulletin.com) are for informational and educational purposes only and do not constitute financial, investment, or legal advice. Securities market investments are subject to market risks; please read all offer documents (DRHP/RHP) thoroughly before committing capital. Grey Market Premium (GMP) figures are unofficial, unregulated street estimates. Always consult a SEBI-registered investment advisor before making financial decisions.
Sources cross-checked for this article: Economic Times, Livemint, BSE India filings, Screener.in, Anand Rathi Research.