
MUMBAI / NEW DELHI, SEPTEMBER 26, 2026 — During trading sessions through Saturday, September 26, 2026, market participants across Dalal Street closely tracked the Nifty 50 index following its steepest weekly correction in six years. According to financial reports and live index trackers published by Moneycontrol and Livemint on Friday, September 25, 2026, the benchmark index faced intense selling pressure driven by escalating crude oil prices touching $102 per barrel and hardening global bond yields.
The severe downturn has triggered widespread debate among equity analysts regarding whether the Nifty 50 can recover ground and successfully test the psychological 25,000 milestone before the end of the year. Having previously crossed the 26,000 threshold two years ago, the index currently trades roughly 3,000 points below its all-time high, prompting institutional desks at brokerages like Motilal Oswal and ICICIdirect to reassess valuation metrics, sector earnings growth, and macroeconomic tailwinds.
NIFTY 50
INDEX
▲ +₹77.40 (+0.34%)
Day Range: ₹23,020.95 – ₹23,162.70
52W Range: ₹22,182.55 – ₹26,373.20
● Real-Time Feed
Key Market Milestones & Timeline Context
| Event / Catalyst Milestone | Exact Calendar Date |
|---|---|
| Crude Oil Spikes Past $102 & Insurance Stocks Slide | Thursday, September 24, 2026 |
| Nifty 50 Posts Record Weekly Drop in 6 Years | Friday, September 25, 2026 |
| Expert Roundtable on 25,000 Index Recovery Target | Saturday, September 26, 2026 |
Macroeconomic Headwinds and Sectoral Impact
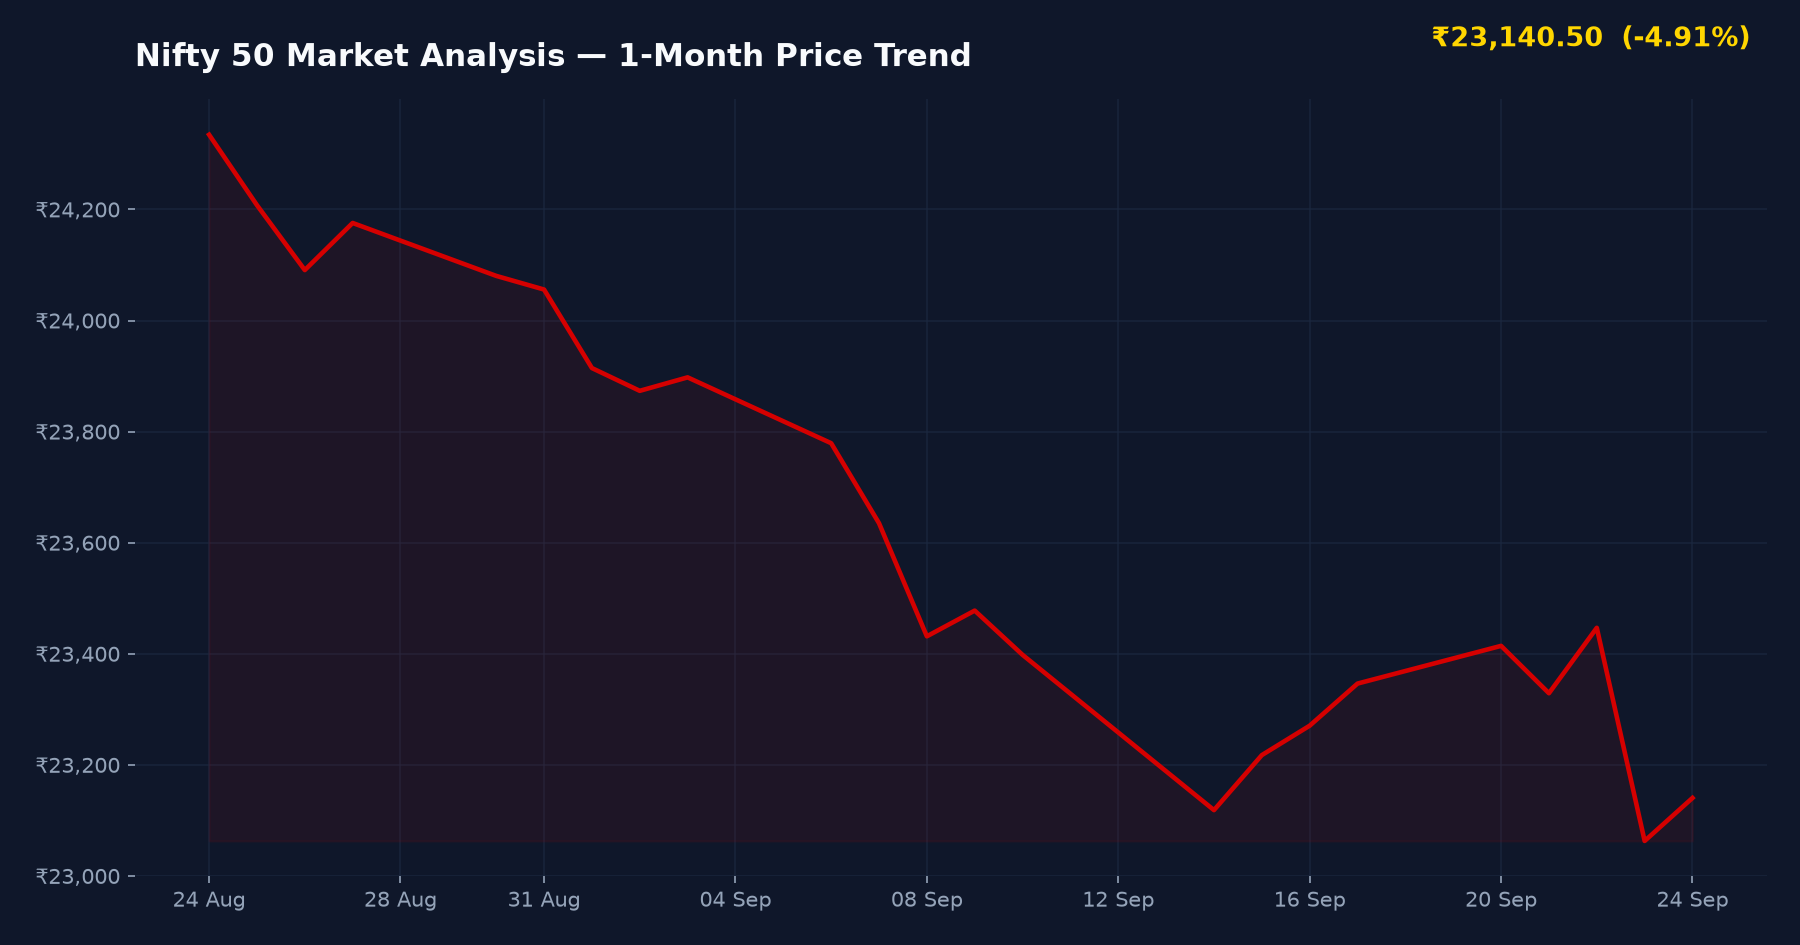
Data compiled from Economic Times and Livemint indicates that the recent market correction was intensified by a confluence of external pressures. Beyond the surge in crude oil prices, regulatory proposals by IRDAI introduced on September 24, 2026, generated considerable headwinds for financial and insurance equities, dragging down major index constituents. Furthermore, rising global yields have prompted foreign portfolio investors (FPIs) to reallocate capital away from emerging markets.
Fundamental evaluations sourced from Screener.in and Trendlyne suggest that while headline valuations appeared stretched following earlier rallies, the sharp 3,000-point pullback has compressed price-to-earnings multiples across heavy-weight sectors including banking, IT, and core manufacturing.
Peer Index & Regional Benchmark Comparison
| Index / Benchmark | Recent Trend / Performance | Key Note |
|---|---|---|
| Nifty 50 Index | -3,000 pts from peak | Steepest weekly drop in 6 years |
| BSE Sensex | Down ~1% in sessions | Impacted by financial stock sell-off |
| GIFT Nifty Cues | Cautious / Mixed | Reflecting Asian market volatility |
Peer valuation data sourced from Screener.in and Trendlyne
Bull vs. Bear Catalysts for Nifty 50 Recovery
Bullish Drivers:
- Strong domestic institutional investor (DII) inflows consistently absorbing foreign selling pressure.
- Robust corporate earnings growth across core economic sectors anticipated in upcoming quarterly prints.
- Attractive risk-reward ratios emerging in blue-chip large-cap equities following the recent 6-year record correction.
Bearish Risks:
- Sustained crude oil prices above $102 threatening India’s current account deficit and fiscal stability.
- Persistent high US Treasury yields triggering continuous FPI outflows from domestic equities.
- Regulatory overhangs impacting high-weight financial services and insurance segments.
Investment Verdict & Analytical Summary
Suitable For: Long-term institutional investors and systematic accumulation retail portfolios
Risk Level: Medium-High — Market volatility remains elevated due to global crude and yield fluctuations
Key Watch Point: Crude oil price trajectory and subsequent foreign institutional flow reversals
Frequently Asked Questions
1. Can the Nifty 50 realistically hit 25,000 this year despite recent corrections?
While market experts acknowledge that the recent correction has delayed immediate momentum, a recovery toward 25,000 remains plausible if global crude prices moderate and domestic institutional buying sustains robust earnings support through upcoming quarters.
2. What triggered the sharp recent sell-off in the Nifty 50 index?
The primary catalysts included crude oil breaking above $102 per barrel, surging global bond yields, and regulatory proposals impacting key financial and insurance stocks as reported across major financial desks on September 24-25, 2026.
3. How should investors navigate current market volatility?
Analysts recommend focusing on high-quality blue-chip stocks with resilient balance sheets, utilizing staggered systematic investment plans (SIPs) rather than lump-sum deployments during periods of heightened macroeconomic uncertainty.
SEBI Compliance & Statutory Disclaimer
The information and analysis presented on IPO Bulletin (ipobulletin.com) are for informational and educational purposes only and do not constitute financial, investment, or legal advice. Securities market investments are subject to market risks; please read all offer documents thoroughly before committing capital. Always consult a SEBI-registered investment advisor before making financial decisions.
Sources cross-checked for this article: Livemint, Moneycontrol, The Economic Times, Screener.in, Trendlyne