

MUMBAI, NOVEMBER 09, 2026 — Technical momentum returned across broader market counters as six constituents within the Nifty 500 index gained over 4% and crossed above their respective 200-day moving averages (DMA) on November 8, 2026, according to scan data compiled by StockEdge. The 200-day moving average represents the average closing price over the trailing 200 trading sessions and functions as an institutional benchmark separating long-term structural uptrends from bearish consolidation on the National Stock Exchange (NSE).
Key Takeaways at a Glance
- Momentum Trigger: Six Nifty 500 companies recorded single-day advances exceeding 4.0% while pushing past their 200 DMAs on November 8, 2026.
- Institutional Significance: The 200 DMA serves as a critical indicator for asset managers assessing structural trend reversals across broader indices.
- Market Breadth: Follows prior multi-stock 200 DMA breakouts tracked on November 2, November 3, and November 6, 2026, indicating rotating sector participation.
NIFTY 50
INDEX
▲ +₹449.80 (+1.83%)
Day Range: ₹24,985.30 – ₹25,131.85
52W Range: ₹22,179.90 – ₹26,373.20
● Real-Time Feed
Technical Scan Schedule & Milestone Timeline
Tracking technical moving average breakouts requires monitoring confirmation across daily closing prints and subsequent session follow-through. Below is the verified timeline of technical scans and tracking windows:
| Technical triggers / Scan Milestone | Confirmed Calendar Date |
|---|---|
| Six Nifty 500 Equities Cross Above 200 DMA (>4% Gain) | November 08, 2026 |
| Prior Large-Cap 200 DMA Expansion Scan (8 Stocks) | November 06, 2026 |
| Mid-Week Broad Market 200 DMA Scan (8 Stocks) | November 05, 2026 |
| Early November Broad Momentum Scan (10 Stocks) | November 03, 2026 |
| First November Nifty 500 200 DMA Scan (6 Stocks) | November 02, 2026 |
Technical Indicators & Market Breadth Metrics
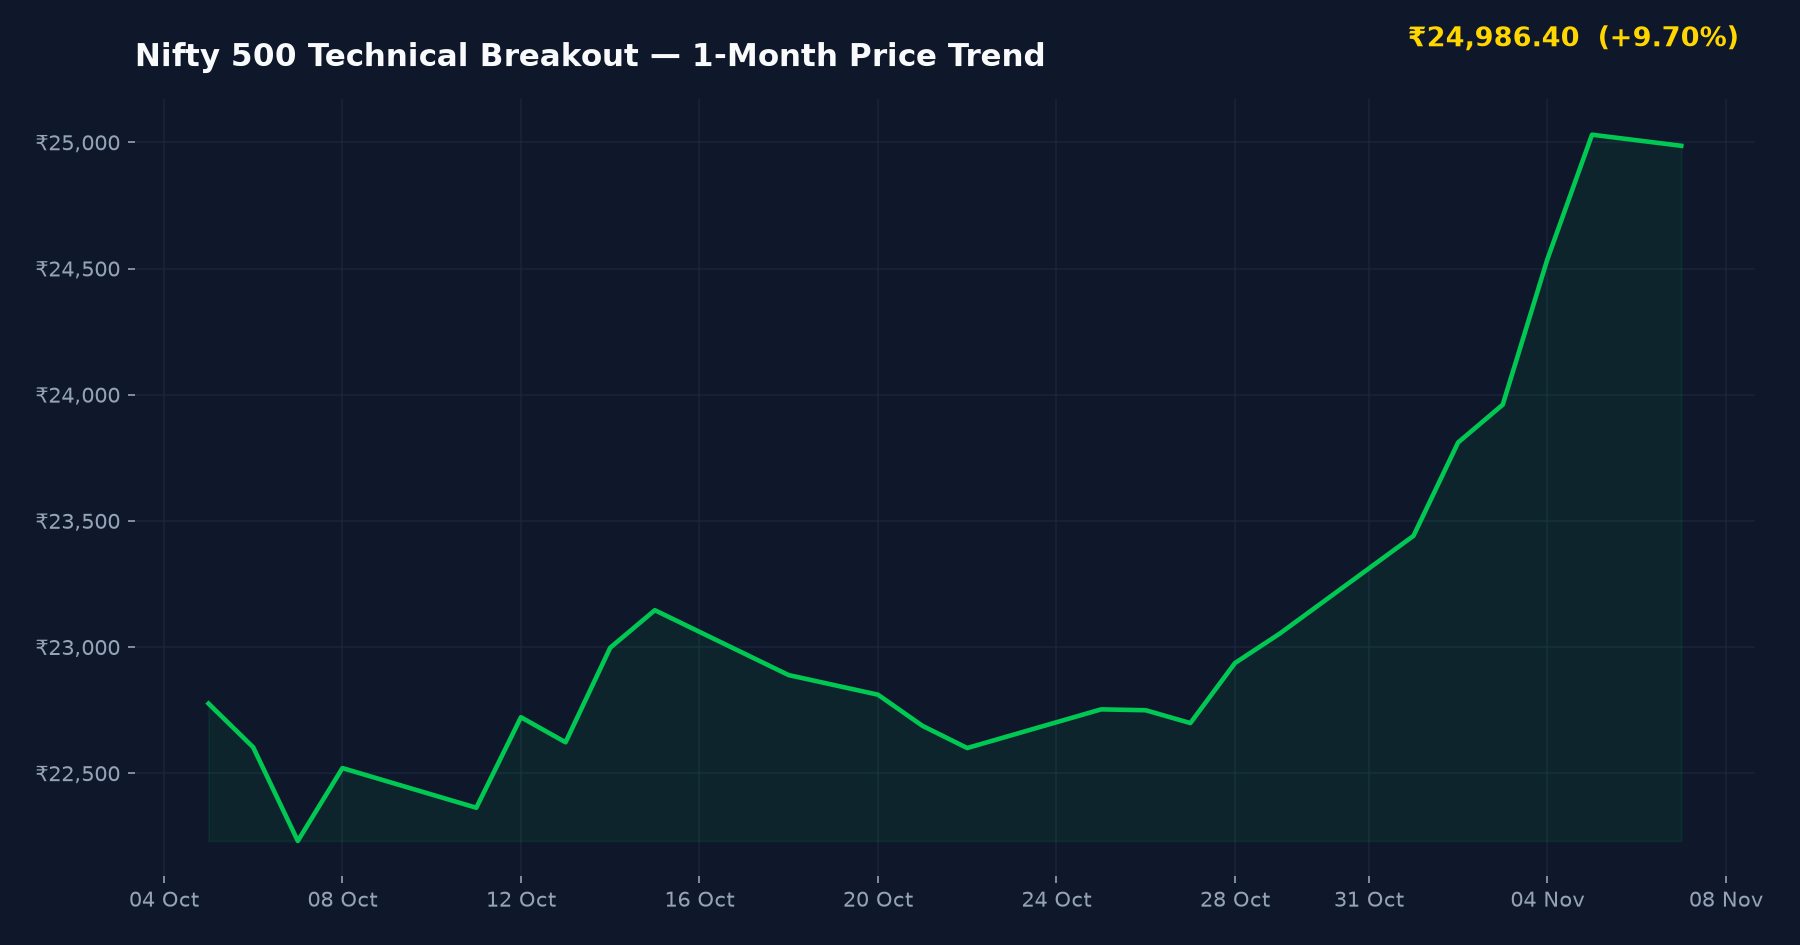
A moving average calculates the arithmetic mean of an asset’s closing prices over a defined duration. When an equity moves from below its 200-day moving average to a verified close above it, technical analysts often track whether the line converts from a structural ceiling (resistance) into a base of support. Market breadth across the Indian market indices dashboard indicates rotating interest across mid-cap and large-cap segments.
| Technical Screen Parameter | Screen Value / Qualification Criteria |
|---|---|
| Universe Tracked | Nifty 500 Constituents |
| Single-Day Minimum Percentage Gain | > 4.00% |
| Primary Moving Average Benchmark | 200-Day Moving Average (200 DMA) |
| Qualifying Counters on November 8, 2026 | 6 Stocks |
| Primary Exchange Listing | NSE India & BSE India |
Institutional Context of 200 DMA Technical Reversals
According to market analytics from StockEdge, Trendlyne, and exchange filings submitted to NSE India and BSE India, technical scans reflecting multiple stocks breaching long-term resistance frequently mirror sector-level capital rotations. Institutional participants, including domestic mutual funds and foreign portfolio investors (FPIs), often evaluate the 200 DMA when rebalancing exposure between cyclical and defensive counters.
During market phases where broader indices consolidate, capital often seeks mispriced opportunities in equities undergoing base formation. While capital flows in primary issuances can be tracked on the live IPO calendar and primary market schedule and secondary listings via the recent IPO listing performance tracker, established Nifty 500 stocks rely on multi-month accumulation patterns to absorb institutional sell orders.
Balanced Technical Framework: triggers vs. Downside Risks
While crossing a critical moving average reflects strong immediate demand, technical crossovers must be viewed in conjunction with volume expansion and broader index trends.
Potential Technical triggers
- Trend Confirmation: Closing above the 200 DMA signals that long-term buyers are absorbing secondary market supply at higher levels.
- Algorithmic Buying Triggers: Systematic investment models and quantitative trading desks often set automated entry screens upon verified closes above long-term moving averages.
- Expansion in Market Breadth: Consecutive sessions of stocks clearing structural hurdle levels indicate that advance-decline ratios across the Nifty 500 are stabilizing.
Key Downside Risks & False Breakouts
- Whipsaw Risk: Equities that lack multi-day volume follow-through frequently retreat below the 200 DMA, trapping aggressive intraday momentum buyers.
- Earnings Disconnect: A technical crossover unsupported by core operational growth, revenue expansion, or margin stability can reverse following quarterly corporate updates.
- Overhead Resistance: Prior trading congestion zones above the 200 DMA can supply immediate selling pressure, stalling continuation rallies.
What to check before trading technical breakouts
- Verify whether delivery volumes expanded significantly alongside the 4% single-day price appreciation.
- Confirm whether the equity sustains its close above the 200 DMA for consecutive sessions rather than slipping back intraday.
- Review quarterly earnings filings, institutional shareholding patterns, and promoter pledge ratios on BSE and NSE.
- Examine sector-specific peer valuations (P/E and P/B multiples) using Screener.in and Trendlyne to assess fundamental alignment.
Frequently Asked Questions
What does crossing above the 200 DMA indicate for Nifty 500 stocks?
Crossing above the 200-day moving average indicates that an equity’s short-term price strength has overtaken its long-term average closing level over the preceding 200 sessions. Institutional desks often interpret this as an early sign of a structural shift from a long-term downtrend into an accumulation or markup phase.
Why is a 4% single-day gain significant during a moving average crossover?
A single-day gain exceeding 4% demonstrates decisive buying momentum rather than passive sideways drift across a technical threshold. Significant price expansion often indicates institutional participation, though confirmation requires evaluating delivery volume trends across subsequent trading days.
Can stocks generate false breakouts above the 200 DMA?
Yes, false breakouts (frequently called whipsaws) occur when an equity briefly pushes past its 200 DMA but fails to attract sustained volume support, causing prices to slide back below the benchmark. Investors typically monitor multi-day closes and fundamental earnings triggers to validate the sustainability of technical moves.
SEBI Compliance & Statutory Disclaimer
The information and analysis presented on IPO Bulletin (ipobulletin.com) are for informational and educational purposes only and do not constitute financial, investment, or legal advice. Securities market investments are subject to market risks; please read all offer documents (DRHP/RHP) thoroughly before committing capital. Grey Market Premium (GMP) figures are unofficial, unregulated street estimates. Always consult a SEBI-registered investment advisor before making financial decisions.
Sources referenced: StockEdge, The Economic Times, Moneycontrol, NSE India filings, BSE India filings.
Reusing this article or its images? Credit IPO Bulletin and link to https://ipobulletin.com/news/nifty-technical-breakout-stocks-cross/. Content licence.