
MUMBAI / NEW DELHI, OCTOBER 23, 2026 — During trading on Friday, October 23, 2026, Indian benchmark equity indices fell for the fourth consecutive session, pulling the Nifty 50 down to the 22,600 mark while the S&P BSE Sensex settled at 73,123.83 amid persistent broad-based selling across mid-cap, small-cap, and metal counters.
MUMBAI / NEW DELHI, NOVEMBER 02, 2026 — During trading on Monday, November 02, 2026, benchmark Indian equity indices recorded decisive gains, with the BSE Sensex surging over 1,200 points and the NSE Nifty 50 settling near 23,450. The powerful market rally was headlined by index heavyweight Reliance Industries Limited (RIL), which marked its strongest single-day advance since 2020 following solid Q2 financial performance, supported by broad-based buying across Tata Steel, Infosys, and ICICI Bank according to official trading data on the National Stock Exchange (NSE).
Key Takeaways at a Glance
- Index Performance: BSE Sensex climbed approximately 1,200 points, while Nifty 50 advanced past 23,450, registering an intraday jump of over 1.2%.
- Heavyweight Contribution: Reliance Industries added 762 points to the Sensex and 198 points to the Nifty in a single session after surging over 5%.
- Market Breadth & triggers: Bullish momentum was reinforced by positive Q2 earnings from RIL, optimism surrounding regulatory proposals on capital gains tax rationalization, and broad gains in banking and technology majors.
NIFTY 50
INDEX
▲ +₹387.70 (+1.68%)
Day Range: ₹23,207.05 – ₹23,440.80
52W Range: ₹22,179.90 – ₹26,373.20
● Real-Time Feed
Key Timeline & Market triggers Calendar
The market movement on November 02, 2026, unfolded following a weekend of corporate quarterly disclosures and macro developments. Track broader sector positioning on our Indian market indices dashboard.
| Market Event / triggers Milestone | Exact Calendar Date |
|---|---|
| Pre-Session Asian & GIFT Nifty Setup | November 02, 2026 |
| Reliance Industries Breakout & Q2 Reaction | November 02, 2026 |
| Nifty Technical Breakout Confirmation | November 02, 2026 |
| Upcoming Weekly Derivative Expiry Window | November 05, 2026 |
Index Performance Snapshot & Heavyweight Contribution
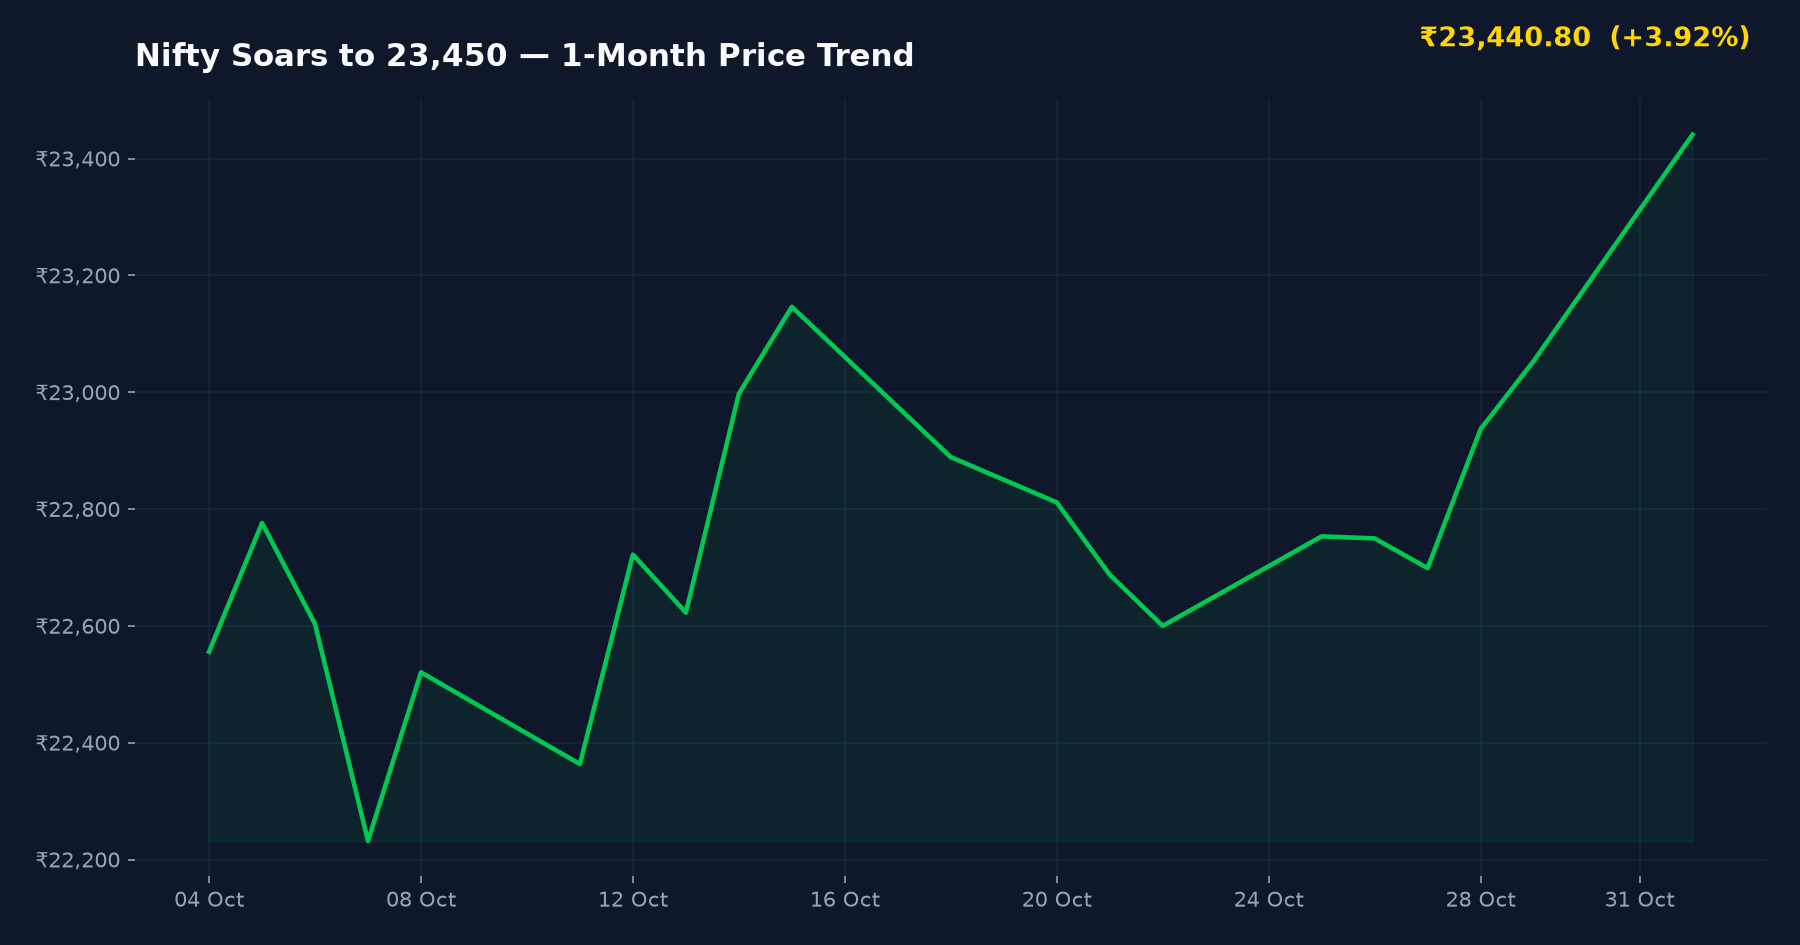
The rally was characterized by concentrated index points driven by core large-cap components. Data compiled by Moneycontrol and Bloomberg shows how key individual equities shaped the day’s performance metrics.
| Index / Stock Metric | Observed Level / Impact |
|---|---|
| BSE Sensex Daily Gain | +1,200 pts |
| NSE Nifty 50 Closing Range | ~23,450 |
| RIL Contribution to Sensex Advance | +762 pts |
| RIL Contribution to Nifty 50 Advance | +198 pts |
| RIL Single-Day Share Price Gain | >5.0% |
Reliance Industries Drives Dalal Street: The Anatomy of a 5% Heavyweight Surge
Market heavyweight Reliance Industries registered its best single-day advance since 2020 on Monday, November 02, 2026. A 5% expansion in RIL’s market capitalization exerts an outsized mathematical impact on India’s free-float market-capitalization-weighted indices, explaining why the conglomerate contributed over 60% of the Sensex’s total point gains during the session.
Historical quantitative analysis compiled by Moneycontrol demonstrates that significant RIL rallies historically correlate with sustained index momentum: in 17 out of 20 past trading sessions where Reliance gained 5% or more, the Nifty 50 extended its positive trajectory in subsequent trading days. Investors monitoring primary paper allocations can reference our live IPO calendar and primary market schedule for institutional fund flows.
Technical Structure: Nifty Breakout Targets 23,600 as Bank Nifty Guards Support
From a technical charting perspective, the swift reclaim of 23,400 confirmed a bullish continuation breakout on the daily charts. Technical analysts noted that the clearing of overhead call option writer congestion between 23,300 and 23,400 triggers an open upside trajectory toward the 23,600 zone.
Conversely, the banking gauge, Bank Nifty, faced moderate relative resistance compared to the broader index, necessitating the defense of its short-term 20-day Exponential Moving Average (EMA). Market breadth remained broad across metals (Tata Steel), enterprise software (Infosys), and private lenders (ICICI Bank), reflecting institutional accumulation across diversified sectoral desks.
Fundamental triggers: Q2 Results, Global Cues, and Regulatory Discussions
Three core triggers underpinned Dalal Street’s strong opening week session:
- Resilient Corporate Earnings: Q2 FY27 earnings disclosures confirmed stable margins for RIL’s retail and digital service arms, dispelling prior street concerns around margin compression in traditional refining segments.
- Policy & Taxation Discussions: Reports circulating across market desks regarding proposals on rationalizing Long-Term Capital Gains (LTCG) structures aided sentiment among Domestic Institutional Investors (DIIs) and Foreign Portfolio Investors (FPIs).
- Supportive Global Background: Steady closing trends across Wall Street benchmarks (DJIA, S&P 500, Nasdaq) and constructive early action on Asian bourses including Nikkei and Kospi provided a supportive backdrop for emerging market equities. Investors can also examine secondary performance via our recent IPO listing performance tracker.
Balanced Market Dynamics: triggers vs. Watch Points
While the single-day surge broke short-term consolidation, active market participants balance structural triggers against near-term technical overheads:
- Upside Drivers: Re-acceleration of large-cap corporate earnings growth, expansion in domestic liquidity from systematic investment plans (SIPs), and technical short-covering above the 23,400 Nifty pivot.
- Downside Risks: Elevated valuation multiples in select mid-cap segments, potential consolidation if Bank Nifty fails to hold its 20-day EMA, and volatility stemming from forthcoming macro data releases.
What to Check Before Initiating Trades
- Verify whether index closes sustain above the 23,400 breakout baseline on consecutive sessions on official BSE India feeds.
- Monitor Bank Nifty’s reaction relative to its 20-day Exponential Moving Average before sizing sector bets.
- Review open interest concentrations on weekly options chains to evaluate institutional hedging levels around 23,500 and 23,600 strikes.
- Examine FII vs. DII cash market net flows to assess institutional follow-through behind the single-day index rally.
Frequently Asked Questions
Why did the Sensex and Nifty 50 rally sharply on Monday, November 02, 2026?
The 1,200-point jump in the Sensex and the Nifty’s move toward 23,450 were primarily driven by a greater than 5% jump in Reliance Industries following solid Q2 earnings, alongside gains in Tata Steel, Infosys, and ICICI Bank. Positive global market cues and market discussions regarding capital gains tax adjustments provided additional momentum.
How much did Reliance Industries contribute to Monday’s index surge?
Reliance Industries single-handedly accounted for approximately 762 points of the Sensex’s gain and 198 points of the Nifty 50’s total advance. This marked the stock’s highest single-day gain since 2020.
What are the critical technical support and resistance levels for Nifty 50 now?
Following the breakout above 23,400, technical market desks target the 23,600 zone as immediate resistance. On the downside, the 23,300–23,350 band represents newly established base support, with Bank Nifty’s 20-day EMA serving as an essential trend validation metric.
SEBI Compliance & Statutory Disclaimer
The information and analysis presented on IPO Bulletin (ipobulletin.com) are for informational and educational purposes only and do not constitute financial, investment, or legal advice. Securities market investments are subject to market risks; please read all offer documents (DRHP/RHP) thoroughly before committing capital. Grey Market Premium (GMP) figures are unofficial, unregulated street estimates. Always consult a SEBI-registered investment advisor before making financial decisions.
Sources referenced: NSE India, BSE India, Moneycontrol, Livemint, The Economic Times.
- : /* IPO Bulletin Responsive Reading & Viewport Protection */ html, body { overflow-x: hidden !important; max-width: 100vw !important; widt…
- : /* IPO Bulletin Responsive Reading & Viewport Protection */ html, body { overflow-x: hidden !important; max-width: 100vw !important; widt…
- : /* IPO Bulletin Responsive Reading & Viewport Protection */ html, body { overflow-x: hidden !important; max-width: 100vw !important; widt…
Key Takeaways at a Glance
- Benchmark Index Levels: The Nifty 50 closed at 22,600, while the BSE Sensex closed at 73,123.83 on Friday, October 23, 2026.
- Extended Losing Run: Both headline gauges logged their fourth straight daily retreat, pressured by intense selling across small-caps, mid-caps, and metals.
- Technical Signals: Moneycontrol market data revealed the Nifty 50 slipped below its 200-week moving average during Friday’s session as selling pressure broadened.
SENSEX
INDEX
▼ ₹125.56 (-0.17%)
Day Range: ₹72,452.37 – ₹73,766.51
52W Range: ₹71,292.88 – ₹86,159.02
● Real-Time Feed
Chronology of Trading Sessions: October 21 to October 23, 2026
The fourth consecutive loss on Dalal Street concluded a volatile weekly stretch that began with sudden mid-week reversals. Regulatory exchange tracking on Indian market indices dashboard showed early momentum repeatedly getting absorbed by institutional supply.
| Event / Market Milestone | Exact Calendar Date |
|---|---|
| Sensex Rises 829 Points in Morning Trade Before Reversal | Wednesday, October 21, 2026 |
| Benchmark Indices Extend Decline into Third Session | Thursday, October 22, 2026 |
| Pre-Market Opening Bell Setup and Global Handover | Friday, October 23, 2026 (08:00 AM IST) |
| Nifty 50 Closes at 22,600 Marking Fourth Day of Losses | Friday, October 23, 2026 (03:30 PM IST) |
Key Closing Metrics: Friday, October 23, 2026
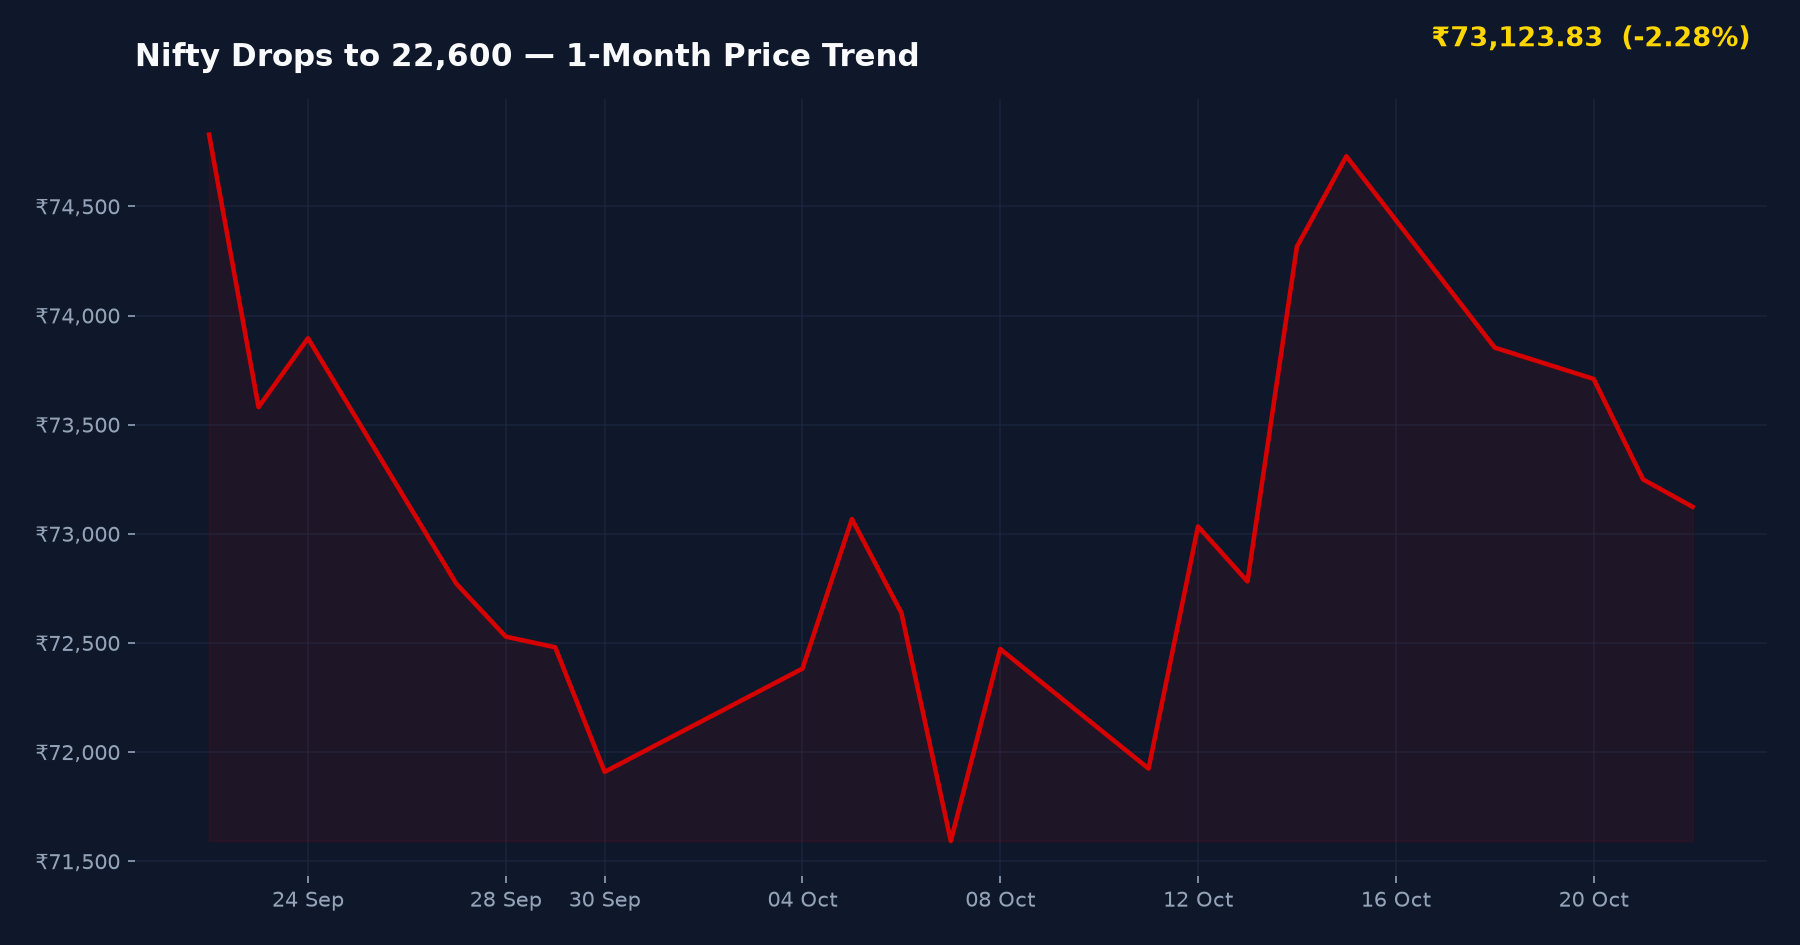
The table below captures the closing prints and structural metrics across primary exchange benchmarks on the National Stock Exchange (NSE) and Bombay Stock Exchange (BSE).
| Market Parameter | Value / Level |
|---|---|
| Nifty 50 Closing Level | 22,600.00 |
| BSE Sensex Closing Level | 73,123.83 |
| Losing Streak Count | 4 Sessions |
| Primary Sectors Under Pressure | Small-caps, Mid-caps, Metals |
| Listing Exchanges | NSE & BSE |
Drivers Behind Dalal Street’s Four-Day Downside Move
Equity markets faced sustained headwinds throughout the trading week ending October 23, 2026. The week featured sharp intra-day whipsaws, notably on Wednesday, October 21, when the Sensex surged 829 points during morning trade before surrendering all intraday gains. That distribution pattern persisted into Friday.
1. Technical Deterioration Across Benchmark Gauges
According to market analytics reported by Moneycontrol, the Nifty 50 breached its 200-week moving average during Friday’s trading. The 200-week moving average represents a long-term structural benchmark tracking the average closing price over a 200-week rolling window. When an index slips below this threshold, algorithmic trading desks and institutional funds often reduce exposure, intensifying downside velocity.
2. Broad Liquidation in Mid-Caps, Small-Caps, and Metals
The selling was not isolated to front-line heavyweights. Broader market indices including the Nifty Midcap and Smallcap gauges witnessed steeper drawdowns than headline indices. Metal equities also came under pronounced liquidation pressure, compounding drag on cyclical portfolios. While institutional selling remained elevated, liquidity flows shifted away from secondary counters toward safety.
3. Movers on the Day: Gainers and Losers in Focus
Individual constituent performance diverged across sectors on Friday, October 23, 2026. According to market data from the Economic Times feed, stocks in the spotlight included Apollo Hospitals, Shriram Finance, Eternal, and Adani Enterprises among the primary movers on the Nifty and Sensex. While select defensive or earnings-backed stocks held firm, capitulation across heavyweights kept the broader indices deeply in the red.
The heightened volatility in secondary markets is also impacting broader primary issuance timing, as tracked on the live IPO calendar and primary market schedule and the recent IPO listing performance tracker, where new debutants face unpredictable listing-day sentiment.
Balanced Investor Framework: Drivers vs. Headwinds
Evaluating the technical posture of Indian equities requires assessing prevailing stabilization factors alongside key systemic risks:
- Stabilization Factors:
- The Nifty 50 tested key round-number support near 22,600, where historical accumulation zones emerge.
- Domestic institutional liquidity has historically absorbed institutional supply during prolonged weekly corrections.
- Select defensive pockets, such as healthcare names like Apollo Hospitals, exhibited relative strength against cyclical selloffs.
- Downside Headwinds:
- A sustained close below the 200-week moving average risks extending institutional de-risking into upcoming sessions.
- Extended pressure on high-beta sectors, especially metals and small-cap segments, points to cautious retail and HNI risk appetite.
- Global macro volatility across Asian peers (Kospi, Nikkei, Taiwan) and US indices continues to drive gap-down openings.
What to Check Before Initiating Positions
- Verify whether the Nifty 50 maintains support around the 22,600 level on a closing basis across consecutive sessions.
- Check institutional flow data (FII and DII net trading figures) released daily by NSE India.
- Track sector advance-decline ratios to determine whether market breadth is improving or remaining heavily skewed toward decliners.
- Review portfolio allocation weightings in volatile cyclicals such as metals and small-caps relative to capital preservation goals.
Frequently Asked Questions
Why did the Nifty 50 fall to 22,600 on Friday?
The Nifty 50 fell to 22,600 on Friday, October 23, 2026, due to widespread selling across small-cap, mid-cap, and metal stocks. The benchmark’s slip below its 200-week moving average triggered technical selling and extended the market’s losing streak to four straight trading sessions.
What levels did the Sensex and Nifty close at on October 23?
The S&P BSE Sensex finished Friday’s session at 73,123.83, while the Nifty 50 closed at 22,600.00. Both benchmark indices reversed earlier gains seen earlier in the week, reflecting risk-off sentiment across primary and secondary equity desks.
Which stocks were the top movers on Nifty and Sensex?
Constituents in focus during the session included Apollo Hospitals, Shriram Finance, Eternal, and Adani Enterprises, which featured prominently among the day’s top gainers and losers. Detailed individual performance varied widely across defensives and high-beta cyclicals.
SEBI Compliance & Statutory Disclaimer
The information and analysis presented on IPO Bulletin (ipobulletin.com) are for informational and educational purposes only and do not constitute financial, investment, or legal advice. Securities market investments are subject to market risks; please read all offer documents (DRHP/RHP) thoroughly before committing capital. Grey Market Premium (GMP) figures are unofficial, unregulated street estimates. Always consult a SEBI-registered investment advisor before making financial decisions.
Sources referenced: Economic Times, Moneycontrol, Livemint, NSE India, BSE India.
Reusing this article or its images? Credit IPO Bulletin and link to https://ipobulletin.com/news/nifty-drops-breakdown-sensex-4-day/. Content licence.