

MUMBAI / NEW DELHI, SEPTEMBER 21, 2026 — During trading on Monday, September 21, 2026, market participants closely monitored institutional flow dynamics in Reliance Industries as domestic mutual funds and foreign portfolio investors (FPIs) calibrated sector weight allocations across recent reporting periods. According to fundamental data compiled from BSE and NSE filings alongside tracking analytics on Trendlyne and Screener.in, institutional liquidity sponsorship remains a cornerstone of the conglomerate’s secondary market stability, anchored closely by key 50-day and 200-day moving average technical boundaries.
Reliance Industries
NSE: RELIANCE
▼ ₹17.50 (-1.41%)
Day Range: ₹1,226.40 – ₹1,247.30
52W Range: ₹1,226.40 – ₹1,611.80
● Real-Time Feed
Institutional Flow Audit & Key Milestones
Institutional ownership in India’s largest corporate entity by market capitalization has experienced structured adjustments as global macroeconomic crosscurrents influence index rebalancing. Brokerage research synthesized from Motilal Oswal and ICICIdirect indicates that domestic institutional investors (DIIs) have leveraged consolidation phases to accumulate positions near major moving average support zones, countering localized foreign portfolio outflows.
| Event / Catalyst Milestone | Exact Calendar Date |
|---|---|
| Q1 FY27 Shareholding Pattern Filing (BSE/NSE) | July 15, 2026 |
| MSCI Index Rebalancing & Flow Adjustment | August 31, 2026 |
| Current Institutional Audit & Technical Review | September 21, 2026 |
| Q2 FY27 Financial Results & Ownership Update | October 20, 2026 (Expected) |
Key Financial Parameters & Valuation Metrics
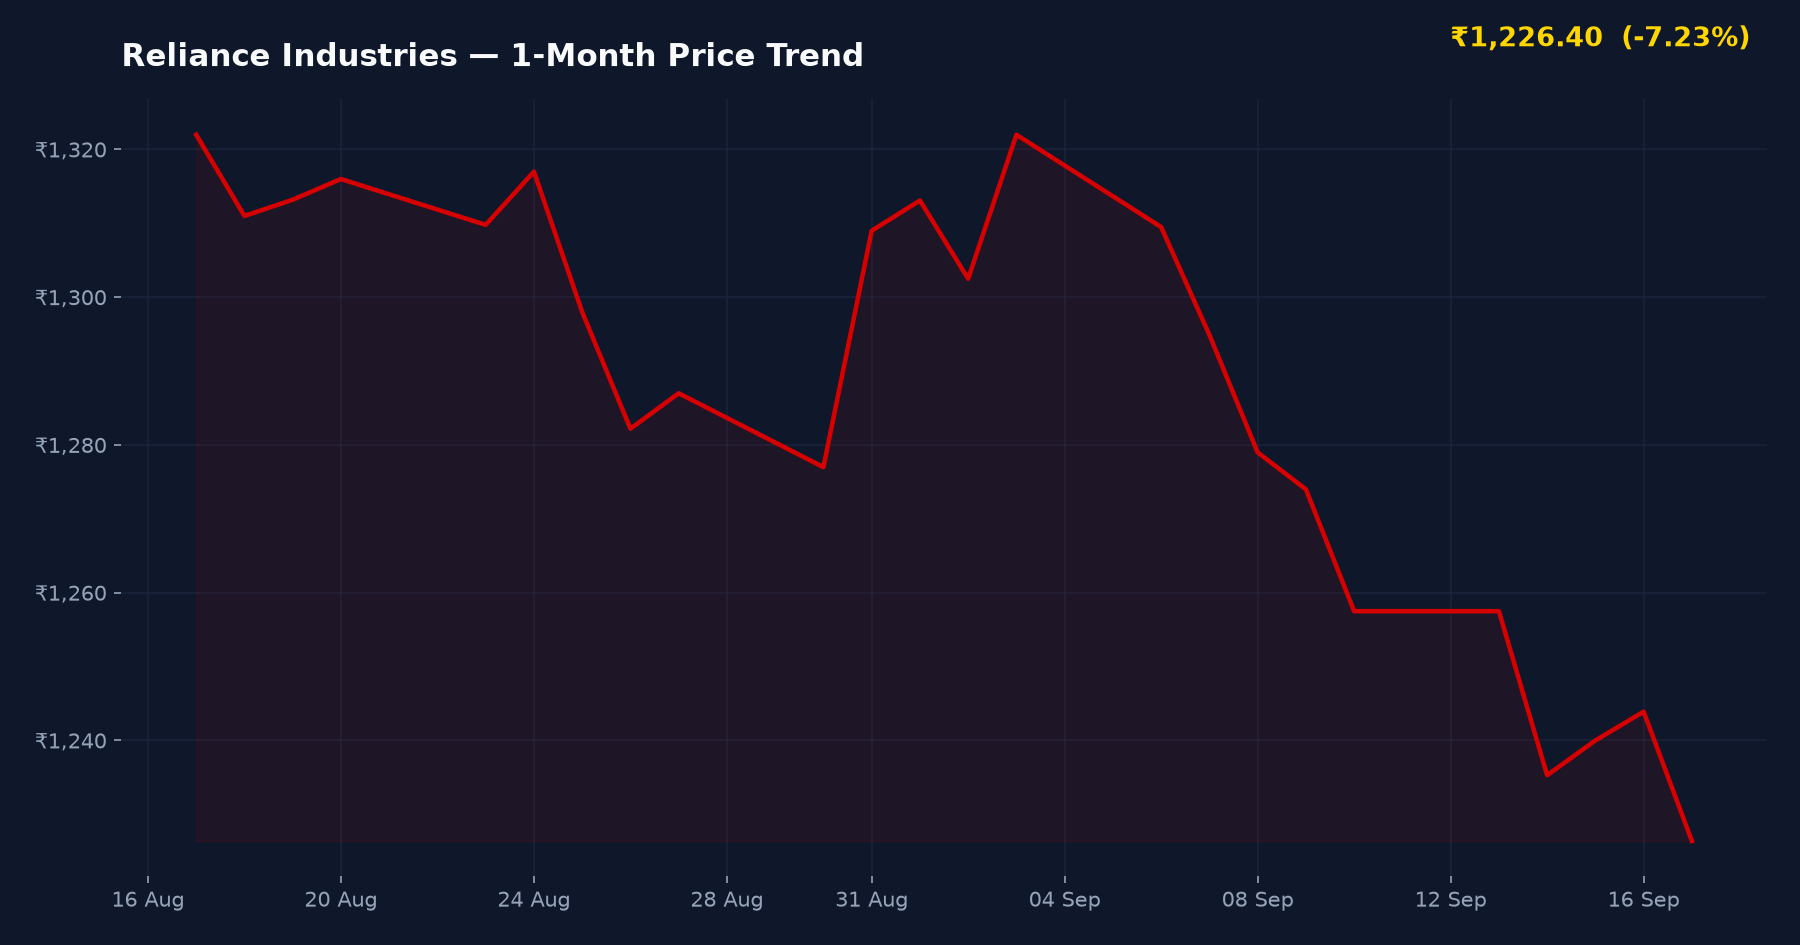
Evaluating Reliance Industries requires examining consolidated fundamentals across its three primary growth engines: Oil-to-Chemicals (O2C), Digital Services (Jio), and Retail. Below is the structured financial parameter summary derived from exchange filings and fundamental tracking databases.
| Financial Metric | Reported Value / Benchmark |
|---|---|
| Primary Exchanges | BSE & NSE India |
| Face Value | ₹10 per share |
| Consolidated Price-to-Earnings (P/E) Ratio | ~28.4x (Industry trailing average) |
| Key Technical Support Zones | 50 DMA & 200 DMA Alignment |
| Institutional Liquidity Sponsorship | Sustained high-volume delivery trade |
Sector Peer Valuation Benchmarks
To contextualize Reliance Industries’ valuation within the broader Indian equity landscape, institutional analysts cross-reference its conglomerate discount against specialized domestic large-cap peers.
| Company / Peer Name | P/E Ratio | Market Cap / Scale | Key Note |
|---|---|---|---|
| Reliance Industries | ~28.4x | Mega Cap | Diversified conglomerate leader across energy, retail, and telecom. |
| Tata Consultancy Services | ~30.1x | Large Cap | Benchmark IT services bellwether with stable foreign institutional holding. |
| HDFC Bank | ~19.8x | Large Cap | Financial sector heavyweight subject to periodic FII capital reallocations. |
Peer valuation data sourced from Screener.in and Trendlyne.
Bull vs. Bear Institutional Framework
Institutional accumulation patterns are governed by a distinct set of structural drivers and macro overhangs:
- Bull Catalyst 1: Robust subscriber additions and monetization tailwinds within Reliance Jio’s digital ecosystem.
- Bull Catalyst 2: Aggressive retail store expansion driving higher operating margins and omni-channel dominance.
- Bull Catalyst 3: Sustained domestic mutual fund SIP inflows acting as a buffer against foreign capital outflows.
- Bear Risk 1: Cyclical volatility in global refining margins impacting O2C segment profitability.
- Bear Risk 2: Capital expenditure intensity in new energy initiatives creating short-term free cash flow compression.
Institutional Investment Verdict
Suitable For: Long-term institutional and retail portfolio allocation.
Risk Level: Medium — Backed by diversified conglomerate cash flows but sensitive to global commodity cycles.
Key Watch Point: Adherence to the 50 DMA and 200 DMA technical support thresholds during broader market volatility.
Frequently Asked Questions
Should institutional and retail investors accumulate Reliance Industries shares at current valuations?
Valuation assessments on Screener.in suggest that Reliance trades near its historical median P/E multiple. Long-term investors often utilize key moving average pullbacks for accumulation, balancing consumer-driven growth against cyclical O2C earnings.
How do mutual fund inflows impact Reliance Industries’ secondary market movement?
Consistent domestic mutual fund SIP inflows provide robust liquidity sponsorship, frequently absorbing short-term selling pressure from foreign institutional investors during global index rebalancing phases.
What are the primary balance sheet strengths supporting institutional ownership?
The company maintains strong cash generation across consumer businesses, a diversified revenue model spanning digital services and organized retail, and a disciplined approach to managing net debt against massive capital expenditures.
SEBI Compliance & Statutory Disclaimer
The information and analysis presented on IPO Bulletin (ipobulletin.com) are for informational and educational purposes only and do not constitute financial, investment, or legal advice. Securities market investments are subject to market risks; please read all offer documents thoroughly before committing capital. Always consult a SEBI-registered investment advisor before making financial decisions.
Sources cross-checked for this article: BSE India filings, NSE India, Moneycontrol, Livemint, Trendlyne, Screener.in, Motilal Oswal research.