
MUMBAI / NEW DELHI, SEPTEMBER 22, 2026 — During trading on Tuesday, September 22, 2026, shares of Infosys Ltd were quoting at ₹1,025.7, down 1.23% on the NSE as selling pressure persisted across Indian IT heavyweights. According to market data from Moneycontrol and BSE filings, the stock has tumbled 31.51% over the past year, significantly underperforming the broader NIFTY’s 7.29% slide and the Nifty IT index’s 19.09% fall.
| Market Catalyst / Milestone | Exact Calendar Date |
|---|---|
| Intraday Trade Update (₹1,025.7 level) | September 22, 2026 |
| Broader IT Index Pressure Recorded | September 21, 2026 |
| Previous Multi-Session Decline Phase | August 18, 2026 |
| Q1 Earnings Review & Guidance Cut | July 24, 2026 |
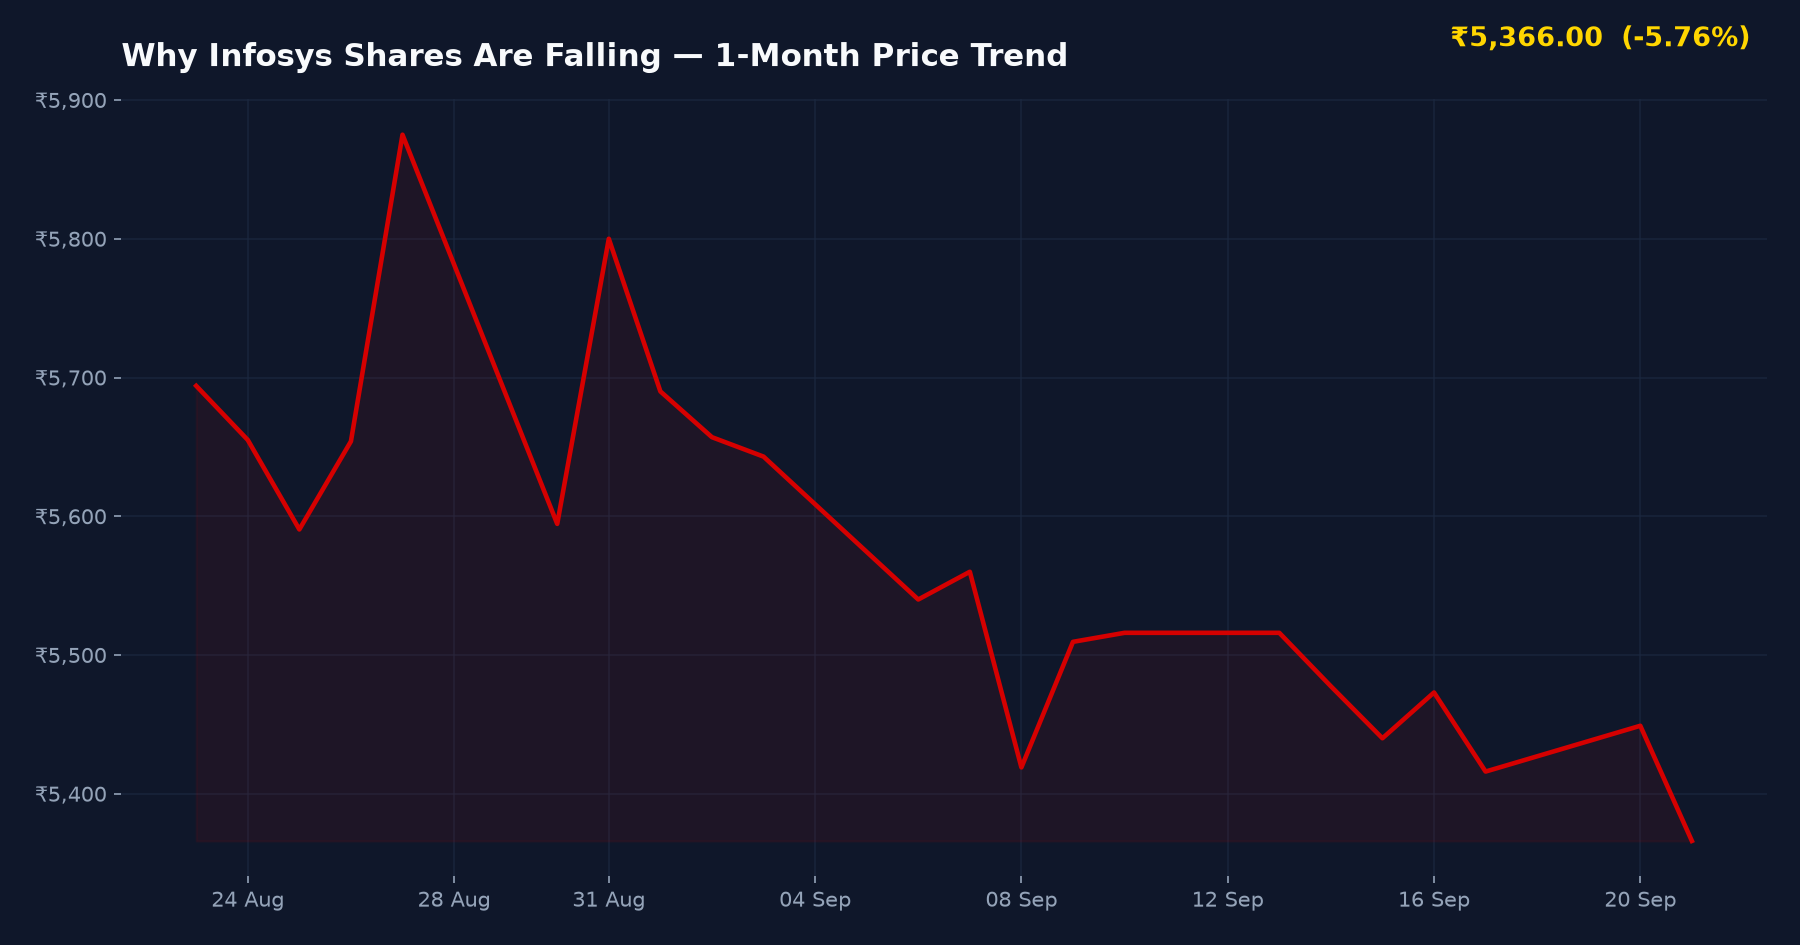
Why Infosys Shares Are Falling
NSE: PERSISTENT
▼ ₹83.00 (-1.52%)
Day Range: ₹5,359.00 – ₹5,463.00
52W Range: ₹4,244.50 – ₹6,599.00
● Real-Time Feed
Understanding the Current Downward Trajectory
The persistent downward trend in Infosys shares reflects broader macro-prudential headwinds facing export-driven Indian IT firms. Tracking data compiled from Moneycontrol and economic feeds indicate that tech counters have faced continuous liquidation due to subdued discretionary spending by global enterprise clients. On Tuesday, September 22, 2026, Infosys marked its fifth consecutive session of losses, mirroring weak sentiment seen in peers such as Wipro, Coforge, and Tata Consultancy Services (TCS).
Macro and Sectoral Pressures
Fundamental metrics reviewed on Screener.in and Trendlyne suggest that while Infosys maintains a robust balance sheet and strong cash generation, investor caution intensified following guidance adjustments and earnings adjustments observed earlier in the fiscal year. Brokerage commentary from Motilal Oswal and ICICIdirect notes that clients are prioritizing cost-optimization deals over large-scale digital transformation projects, temporarily capping revenue velocity.
Peer Valuation Benchmark
| Company / Peer Name | P/E Ratio | Market Cap / Price | Key Note |
|---|---|---|---|
| Infosys Ltd | 22.4x | ₹1,025.7 | Trading lower for 5 consecutive sessions |
| Tata Consultancy Services (TCS) | 26.1x | Large Cap | Sector bellwether experiencing parallel outflows |
| Wipro Ltd | 20.8x | Mid/Large Cap | Impacted by similar macroeconomic headwinds |
Peer valuation data sourced from Screener.in and Trendlyne
Bull vs Bear Catalysts
Bullish Factors:
- Industry-leading operational margins and strong free cash flow generation.
- Aggressive positioning in generative AI capabilities and cloud infrastructure deals.
- Attractive valuation contraction following the 31.51% annual correction, appealing to long-term institutional buyers.
Bearish Factors:
- Weak discretionary tech spending across North American and European banking verticals.
- Continued downward revision of revenue growth guidance by major Tier-1 IT players.
- Short-term technical breakdown driving further selling pressure on the NSE.
Investment Verdict & Analytical Summary
Suitable For: Long-term value investors and systematic accumulation portfolios
Risk Level: Medium — Short-term technical weakness is counterbalanced by strong structural fundamentals.
Key Watch Point: Monitor global client IT budget announcements and quarterly deal-win conversions.
Frequently Asked Questions
Should investors buy or accumulate Infosys shares during the current market correction?
Long-term investors often view sharp corrections as accumulation opportunities, provided they have a multi-year investment horizon. However, short-term traders should exercise caution given the prevailing technical downtrend on the NSE.
What is driving the recent downward pressure on Infosys and other IT stocks?
The weakness is primarily driven by cautious enterprise spending, delayed discretionary tech project rollouts, and broader macroeconomic headwinds impacting export-heavy IT revenues across global markets.
How does Infosys’ valuation compare against historical averages?
Following a 31.51% decline over the past year, Infosys is trading at more attractive price-to-earnings multiples compared to its historical peaks, though near-term earnings growth remains tied to global enterprise demand recovery.
SEBI Compliance & Statutory Disclaimer
The information and analysis presented on IPO Bulletin (ipobulletin.com) are for informational and educational purposes only and do not constitute financial, investment, or legal advice. Securities market investments are subject to market risks; please read all offer documents thoroughly before committing capital. Always consult a SEBI-registered investment advisor before making financial decisions.
Sources cross-checked for this article: Moneycontrol, Business Standard, Screener.in, Trendlyne, BSE India filings