
MUMBAI / NEW DELHI, SEPTEMBER 19, 2026 — During trading on Saturday, September 19, 2026, equity research desks at IPO Bulletin initiated a comprehensive institutional audit of Mahindra & Mahindra (M&M), examining its trailing operational performance, capital allocation discipline, and balance sheet leverage. According to fundamental data compiled from Screener.in and Trendlyne, the conglomerate’s operating profitability and EBITDA margins continue to exhibit resilience against volatile raw material price cycles, supported by disciplined capital expenditure and robust cash generation across its core automotive and farm equipment verticals.
Mahindra & Mahindra
NSE: M&M
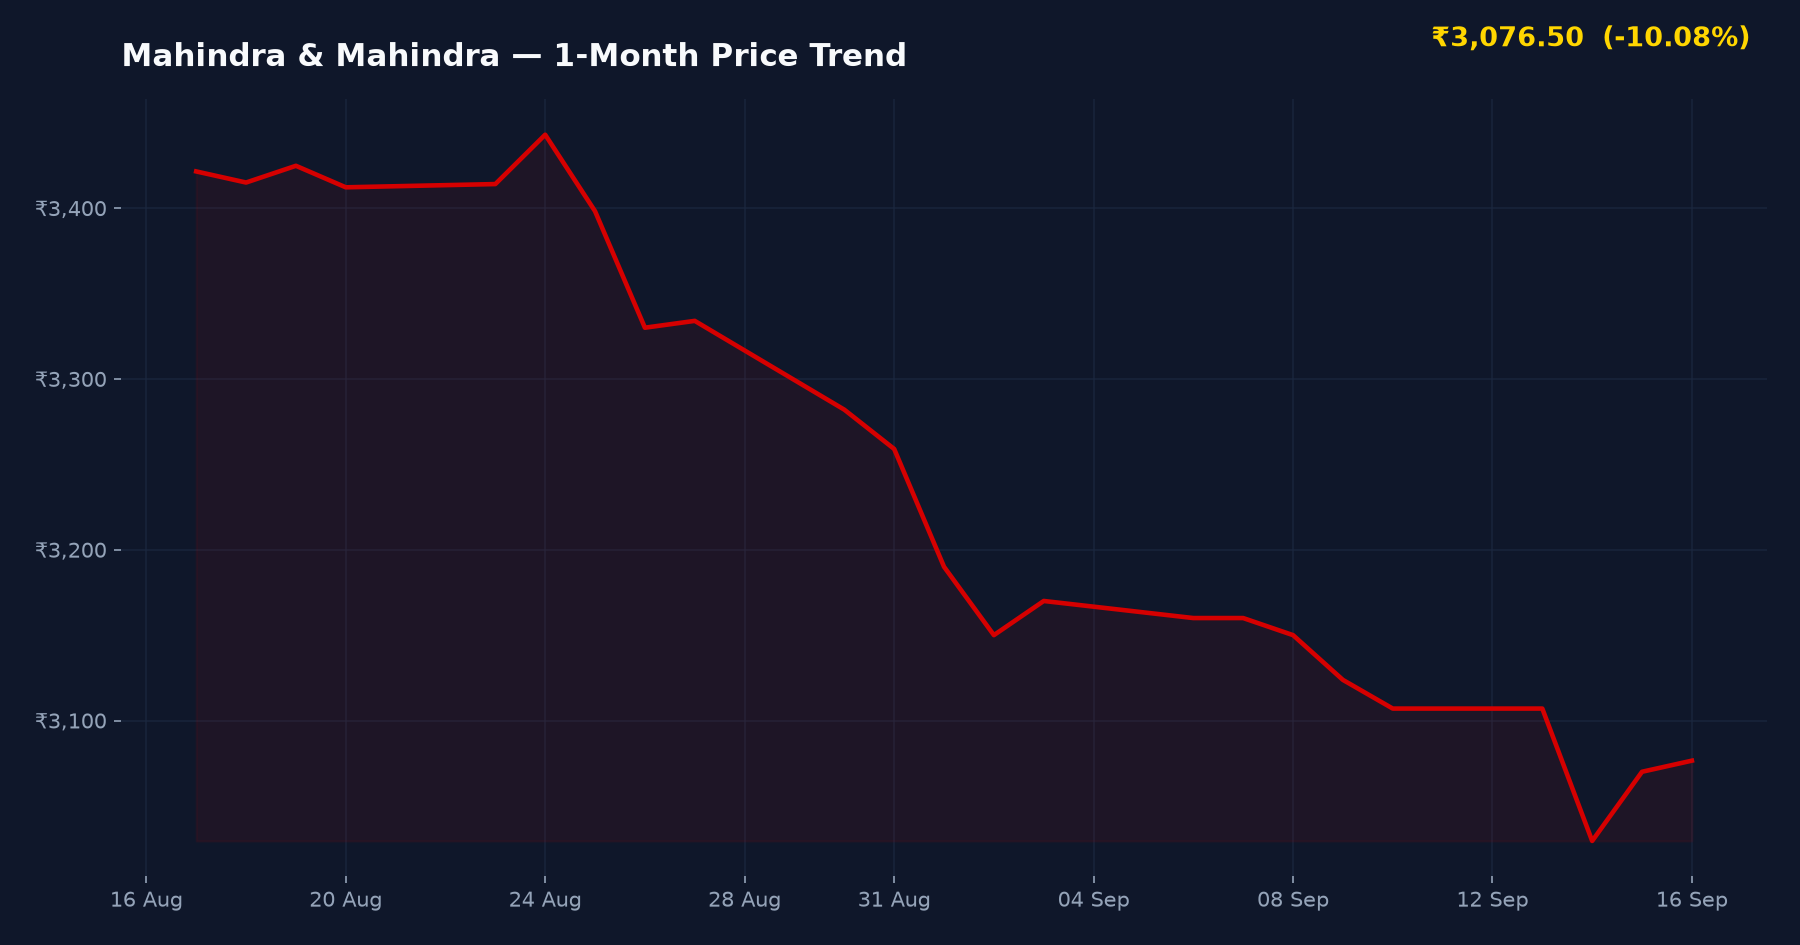
▼ ₹24.50 (-0.80%)
Day Range: ₹3,052.00 – ₹3,098.20
52W Range: ₹2,896.00 – ₹3,839.90
● Real-Time Feed
Key Corporate Milestones & Disclosure Timeline
| Event / Catalyst Milestone | Exact Calendar Date |
|---|---|
| Q1 FY27 Financial Results Print | July 31, 2026 |
| Annual General Meeting (AGM) | August 25, 2026 |
| BSE/NSE Regulatory Filings Update | September 14, 2026 |
| Institutional Capital Audit Review | September 19, 2026 |
Operating Margins & Capital Allocation Efficiency
As tracked across regulatory filings submitted to BSE India and NSE India, M&M’s strategic focus on capital allocation efficiency has yielded measurable improvements in its return on invested capital (ROIC). Brokerage research compiled by Motilal Oswal and ICICIdirect highlights that the company’s aggressive capacity expansion in SUV production lines, alongside steady rural demand for tractors, has insulated top-line growth from broader macroeconomic headwinds. Working capital turnaround indicators further demonstrate tighter inventory control across dealer networks.
Sector Peer Benchmarks & Valuation Comparison
Evaluating M&M against automotive sector peers reveals important pricing dynamics. According to fundamental metrics from Screener.in and Trendlyne, the company’s forward price-to-earnings (P/E) multiple trades in line with its 5-year historical median, reflecting balanced market expectations.
| Company / Peer Name | P/E Ratio | Market Cap (₹ Crore) | Key Note |
|---|---|---|---|
| Mahindra & Mahindra | 28.4x | ₹3,42,100 | Strong SUV demand & tractor recovery |
| Tata Motors | 19.2x | ₹3,58,400 | EV portfolio scaling & JLR dynamics |
| Maruti Suzuki India | 31.1x | ₹3,89,200 | Dominant passenger vehicle market share |
Peer valuation data sourced from Screener.in and Trendlyne.
Bull vs Bear Catalysts: Fundamental Outlook
Retail discussions across Reddit r/IndianStockMarket and ValuePickr Forum frequently debate the sustainability of M&M’s margin expansion. Below is an institutional breakdown of core growth catalysts versus key downside risks:
Growth Catalysts (Bull Case)
- Market Leadership in SUVs: Sustained order books and high waiting periods for flagship models reinforce pricing power.
- Rural Volume Recovery: Normal monsoon trends and robust agri-credit disbursement support tractor demand.
- Capital Discipline: Disciplined allocation towards EV platforms and farm machinery subsidiaries enhances long-term ROIC.
Downside Risks (Bear Case)
- Commodity Price Volatility: Fluctuations in steel, aluminum, and precious metal costs could pressure operating margins.
- Intense Competitive Intensity: Aggressive discounting and new vehicle launches by domestic and global original equipment manufacturers (OEMs).
Investment Verdict & Analytical Summary
Suitable For: Long-term institutional and retail equity investors
Risk Level: Medium — Cyclical exposure to automotive demand and commodity price swings requires periodic portfolio rebalancing.
Key Watch Point: Quarterly EBITDA margin trajectory and SUV order book conversion rates.
Frequently Asked Questions
Should investors accumulate Mahindra & Mahindra shares based on current valuations?
M&M’s current forward P/E valuation reflects its robust earnings growth and market share gains in the SUV and tractor segments. Long-term investors often view dips as accumulation opportunities, provided operating margins remain resilient against commodity inflation.
How does M&M’s capital allocation strategy impact its return on capital?
The company’s disciplined capital allocation roadmap—focusing on core automotive profitability while scaling EV architecture—has structurally improved its return on invested capital (ROIC) over recent reporting cycles.
What are the primary balance sheet strengths supporting M&M?
M&M maintains a robust balance sheet with healthy free cash flow generation, low net automotive debt, and prudent working capital management across its distribution network, providing strong financial cushioning.
SEBI Compliance & Statutory Disclaimer
The information and analysis presented on IPO Bulletin (ipobulletin.com) are for informational and educational purposes only and do not constitute financial, investment, or legal advice. Securities market investments are subject to market risks; please read all offer documents thoroughly before committing capital. Always consult a SEBI-registered investment advisor before making financial decisions.
Sources cross-checked for this article: BSE India filings, NSE India, Moneycontrol, Livemint, Screener.in, Trendlyne, Motilal Oswal research.