

MUMBAI, NOVEMBER 09, 2026 — During early trading hours on Monday, Nuvama Wealth Management Ltd reported a consolidated profit after tax (PAT) of ₹303.48 crore for the second quarter of FY27 (Q2 FY27), registering a 19.49% year-on-year increase compared to ₹254.13 crore in the corresponding period of the previous fiscal year. In regulatory filings submitted to the BSE India and NSE India, the integrated wealth management firm recorded consolidated quarterly revenue of ₹1,366 crore, marking a 20.35% expansion driven by capital markets, wealth advisory, and custodial asset services.
Key Takeaways at a Glance
- Net Earnings Growth: Consolidated net profit reached ₹303.5 crore in Q2 FY27, advancing 19.49% YoY from ₹254.13 crore reported in Q2 FY26.
- Top-Line & Scale Expansion: Quarterly consolidated revenues rose 20.35% YoY to ₹1,366 crore, while total client assets scaled 25% YoY to touch ₹5.5 lakh crore.
- Return Ratios: Annualized Return on Equity (RoE) remained elevated at 29%, supported by operational leverage across institutional equities and asset services.
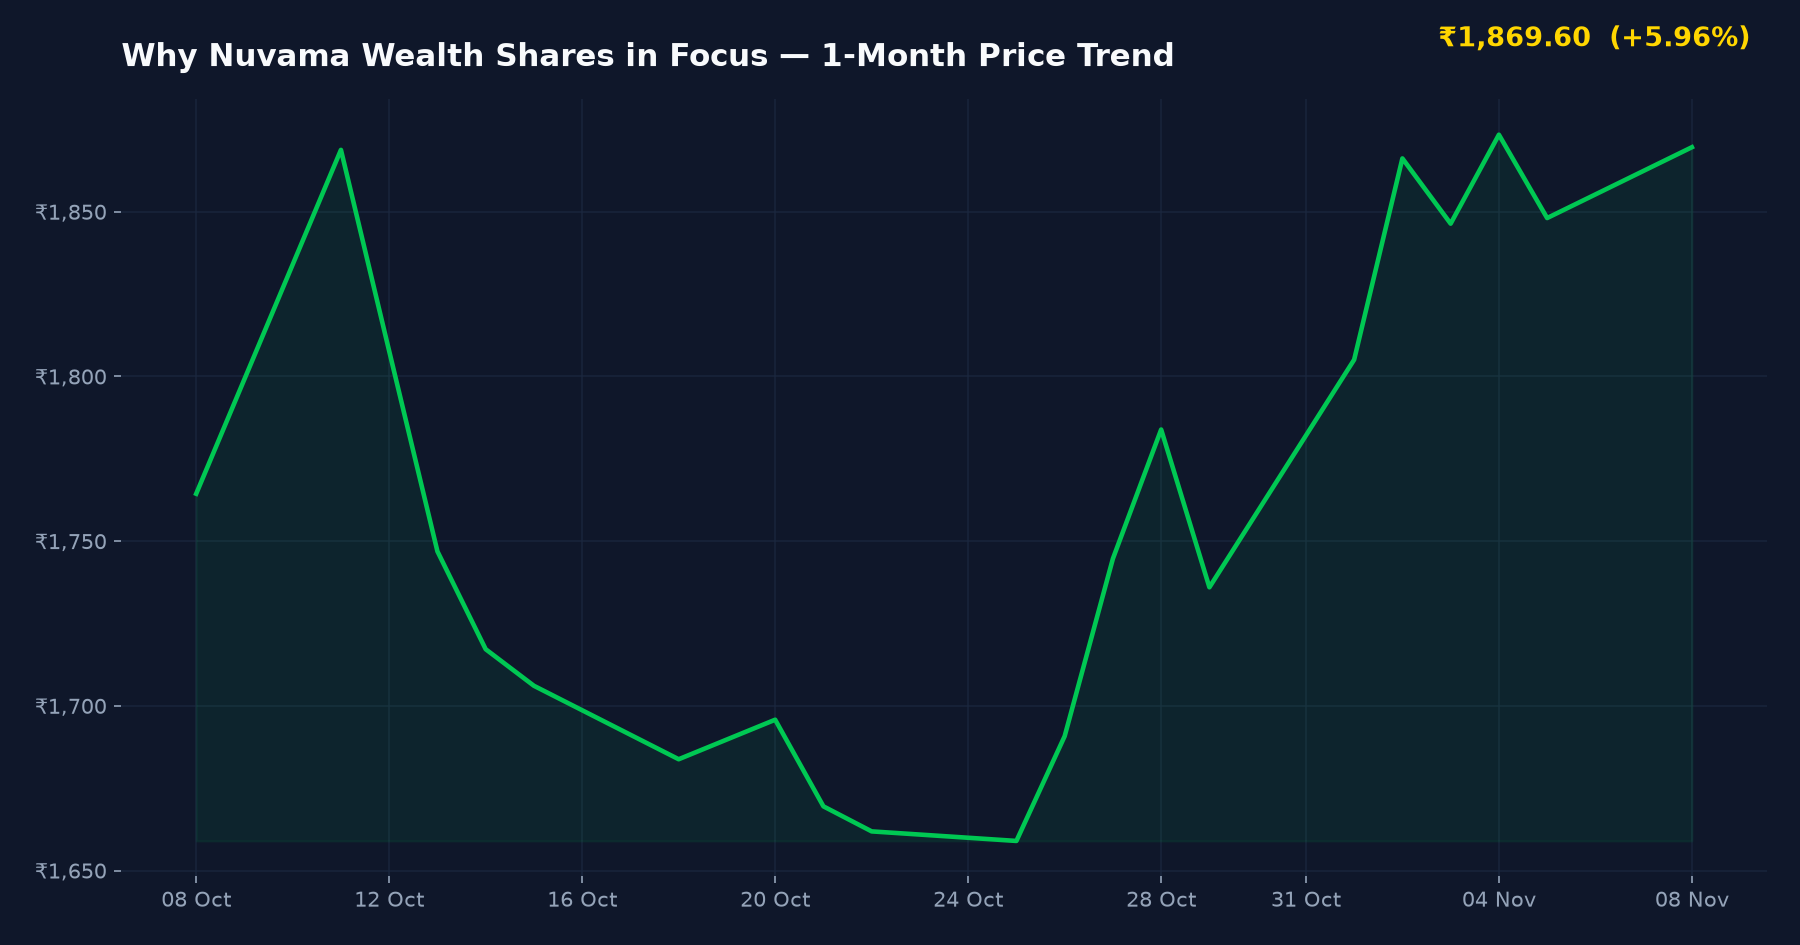
▼ ₹11.40 (-0.61%)
Day Range: ₹1,840.70 – ₹1,943.30
52W Range: ₹1,096.90 – ₹2,066.00
● Real-Time Feed
Nuvama Wealth Management Earnings Calendar & Milestone Timeline
The financial disclosures mark the official completion of Nuvama’s mid-year reporting audit for the fiscal year ending March 31, 2027. Below is the verified chronological reporting schedule:
| Event / Milestone | Recorded Calendar Date |
|---|---|
| Prior-Year Q2 FY26 Financial Declaration | November 06, 2025 |
| Q2 FY27 Consolidated Financial Results Board Meeting & Filing | November 06, 2026 |
| Public Market Dissemination & Exchange Trading Session | November 09, 2026 |
Key Financial Performance Metrics: Q2 FY27 vs Q2 FY26
The quarterly print highlights a reversal from the flattish trajectory observed in Q2 FY26, when net earnings slipped 1.36% YoY. In Q2 FY27, compounding client assets accelerated fee-based revenues across high-net-worth individual (HNI) and family office verticals.
| Financial Metric | Q2 FY26 | Q2 FY27 | YoY Growth (%) |
|---|---|---|---|
| Consolidated Revenue (₹ Cr) | ₹1,135.00 | ₹1,366.00 | +20.35% |
| Consolidated Net Profit (PAT) (₹ Cr) | ₹254.13 | ₹303.48 | +19.49% |
| Total Client Assets (AUM) (₹ Lakh Cr) | ₹4.40 | ₹5.50 | +25.00% |
| Return on Equity (RoE) (Annualized) | — | 29.00% | — |
Operational Drivers: Wealth Management and Asset Services Breakdown
According to disclosures filed with the exchange, the revenue expansion in Q2 FY27 was anchored by three primary operating engines: wealth management, asset services, and capital markets advisory. With client assets swelling by 25% to reach ₹5.5 lakh crore, recurring distribution fees and custodial servicing mandates contributed stable, annuity-style cash flows.
The capital markets division benefited from elevated institutional volumes across secondary equity segments tracked on our Indian market indices dashboard, alongside syndication mandates in primary market deals documented in the recent IPO listing performance tracker. Operational leverage in transaction processing allowed consolidated operating margins to sustain, preserving an annualized Return on Equity (RoE)—a core metric indicating how efficiently management generates profit from shareholders’ equity capital—of 29%.
Fundamental triggers vs Operating Headwinds
Market participants tracking financial services and wealth management firms evaluate earnings quality through cyclical and structural lenses:
- Asset Accumulation Momentum: Expanding client assets to ₹5.5 lakh crore solidifies Nuvama’s market position among top-tier non-banking wealth advisors, increasing recurring management fee shares.
- Diversified Segment Contribution: Balanced revenue distribution across private wealth, custodial asset services, and institutional capital markets dampens volatility compared to pure-play retail broking houses.
- High Capital Efficiency: Operating at an annualized 29% RoE demonstrates disciplined cost-to-income management without requiring aggressive equity dilution.
- Market Volatility Exposure: Transactional brokerage and capital market fees remain sensitive to broader secondary market corrections, which could compress transaction velocity in slower quarters.
- Competitive Fee Pressures: Intensifying competition from bank-backed wealth managers and discount platforms entering the high-net-worth segment may pressure fee yields on standardized financial products.
What to Check Before Evaluating Nuvama Wealth Management
- Net New Money vs Market Appreciation: Verify what portion of the ₹5.5 lakh crore client asset growth was generated by fresh organic inflows versus broad market mark-to-market appreciation.
- Yield on Client Assets: Review segment-level revenue yields across wealth advisory, custodial services, and institutional equities in the investor presentation.
- Cost-to-Income Trajectory: Monitor operating expenses, headcount additions, and digital infrastructure investments relative to quarterly revenue growth.
- Regulatory Shifts: Track SEBI policy updates regarding investment advisor commissions, mutual fund total expense ratio (TER) revisions, and custody norms.
Frequently Asked Questions
What were the core earnings numbers reported in Nuvama Wealth Management Q2 results?
Nuvama Wealth Management reported a consolidated net profit of ₹303.48 crore for Q2 FY27, representing a 19.49% year-on-year increase from ₹254.13 crore in Q2 FY26. Consolidated quarterly revenue expanded 20.35% YoY to ₹1,366 crore, supported by a 29% Return on Equity.
How much did Nuvama Wealth Management’s total client assets grow in Q2 FY27?
Total client assets under management and administration reached ₹5.5 lakh crore by the end of Q2 FY27. This reflects a 25% year-on-year expansion compared to approximately ₹4.40 lakh crore recorded in the same quarter of the prior financial year.
Which business segments drove revenue growth for Nuvama Wealth Management?
Growth during the quarter was driven by the wealth management vertical, asset services, and institutional capital markets. Higher advisory and distribution fees combined with active custodial services supported operating profitability across market cycles.
SEBI Compliance & Statutory Disclaimer
The information and analysis presented on IPO Bulletin (ipobulletin.com) are for informational and educational purposes only and do not constitute financial, investment, or legal advice. Securities market investments are subject to market risks; please read all offer documents (DRHP/RHP) thoroughly before committing capital. Grey Market Premium (GMP) figures are unofficial, unregulated street estimates. Always consult a SEBI-registered investment advisor before making financial decisions.
Sources referenced: BSE India filings, NSE India announcements, The Economic Times, Univest financial updates, and Livemint market records.
Reusing this article or its images? Credit IPO Bulletin and link to https://ipobulletin.com/news/nuvama-wealth-shares-focus-q2/. Content licence.