

MUMBAI / NEW DELHI, NOVEMBER 01, 2026 — Global crude oil benchmarks experienced sharp upward volatility leading into trade on Sunday, November 01, 2026, with Brent crude crossing $116 per barrel and West Texas Intermediate (WTI) surpassing $103 per barrel following escalating US-Iran geopolitical tensions and Middle Eastern supply disruption risks. For domestic benchmark indices—the BSE Sensex and NSE Nifty 50—this energy price shock coincides with the ongoing September-quarter (Q2 FY27) earnings cycle and renewed Foreign Portfolio Investor (FPI) capital outflows, establishing a decisive macro backdrop for Indian equity markets.
Key Takeaways at a Glance
- Energy Price Surge: Brent crude touched highs near $118 per barrel before settling above $116 per barrel on October 30, 2026, driven by Middle Eastern refinery infrastructure attacks and geopolitical posturing.
- Domestic Market Impact: Elevated energy costs threaten input margins across paint, chemical, tyre, and aviation sectors, while upstream producers benefit from higher net realisations.
- Institutional Flows & Earnings: Foreign portfolio flows face headwind pressures from a strengthening US Dollar, making corporate prints across the remainder of the Q2 FY27 scorecard pivotal for broad indices.
NIFTY 50
INDEX
▲ +₹116.35 (+0.51%)
Day Range: ₹22,905.10 – ₹23,118.10
52W Range: ₹22,179.90 – ₹26,373.20
● Real-Time Feed
Confirmed Schedule & Key Macro Milestone Calendar
The upcoming trading week features multiple structural triggers, spanning corporate scorecard prints, global political developments, and regulatory energy tracking metrics:
| Market triggers Milestone | Exact Calendar Date |
|---|---|
| Diplomatic De-escalation Talks Window (Crude $113 Low) | October 29, 2026 |
| Brent Spike to $118 on Geopolitical Escalation | October 30, 2026 |
| India Domestic Refining Run Data Assessment | November 01, 2026 |
| Indian Equity Weekly Opening Trade Execution | November 02, 2026 |
| Primary Market Window & Fresh Issue Bidding | Pending official announcement |
Energy Pricing & Market Valuation Benchmarks
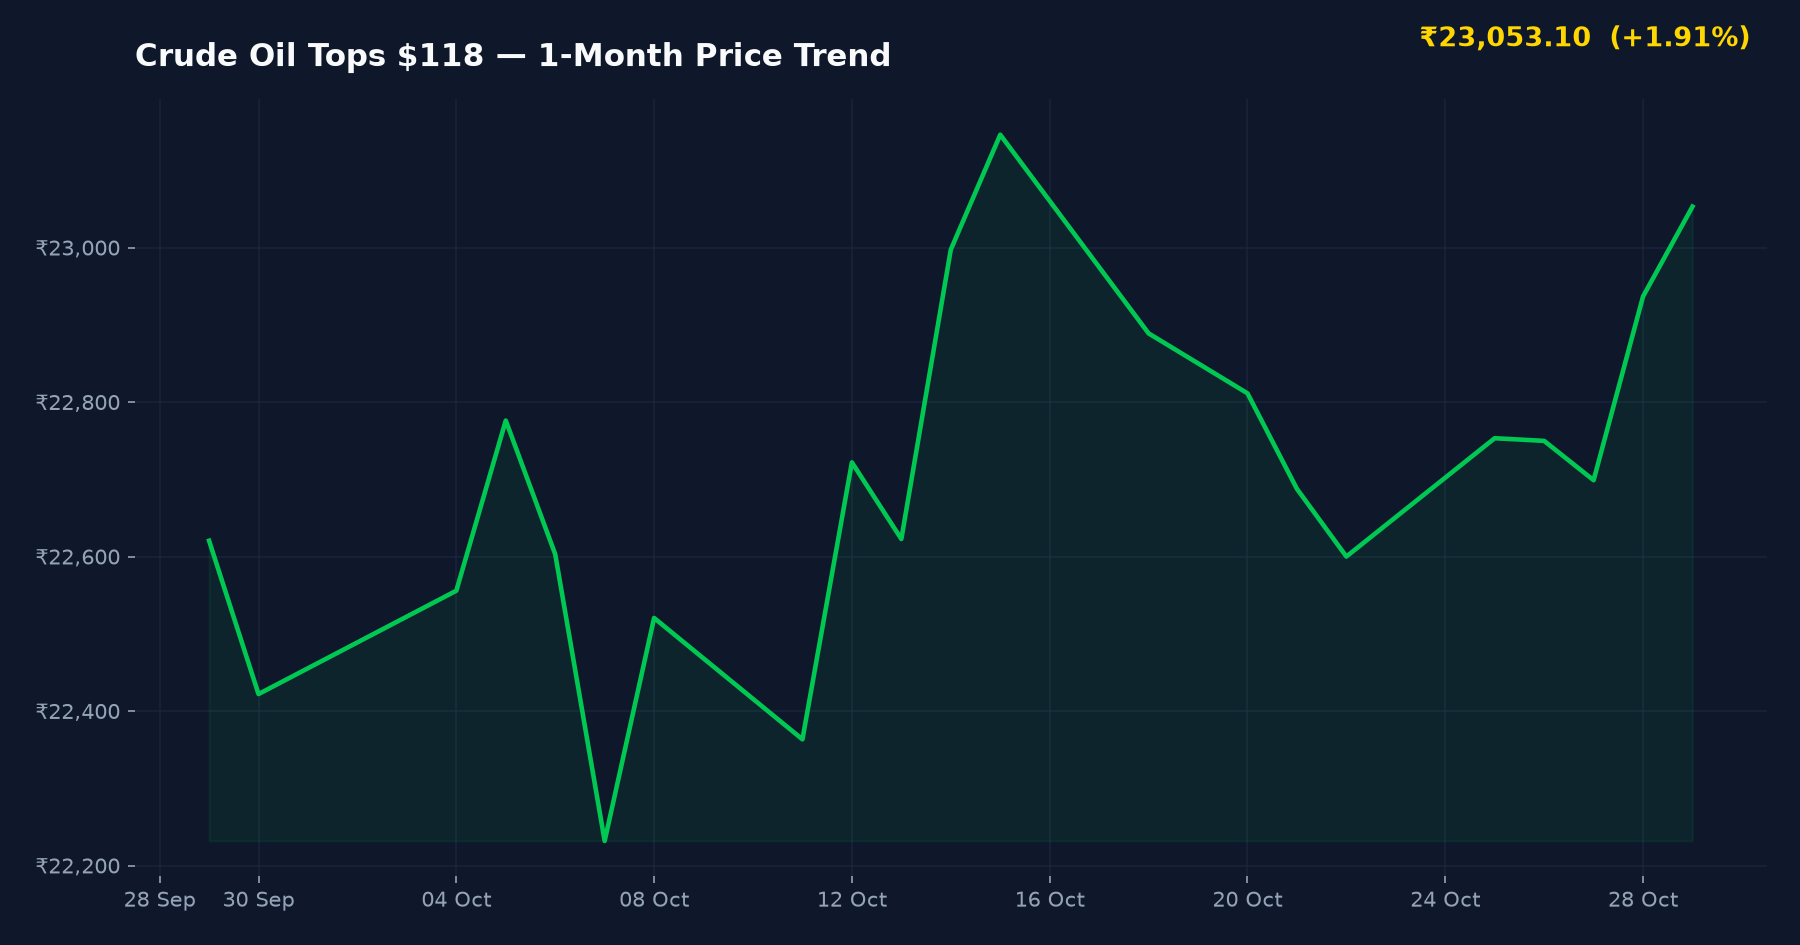
Tracking metrics across global energy desks and research brokerages highlight key operational levels affecting Indian macro stability:
| Macro Parameter | Reported Metric / Range |
|---|---|
| Brent Crude Front-Month Futures | $116.00 / barrel |
| WTI Crude Futures | $103.00 / barrel |
| Intraday Geopolitical Peak (October 30) | $118.00 / barrel |
| Intraday Diplomatic Low (October 29) | $113.00 / barrel |
| Kotak Securities Upgraded FY27 Base Case Forecast | $100.00 / barrel |
Geopolitical Tensions and Upstream vs Downstream Re-Rating
According to market reporting compiled by Moneycontrol and The Economic Times, the surge in crude oil from $113 to $118 on October 30, 2026, reflects heightened supply vulnerability in the Middle East. While downstream oil marketing companies (OMCs) face retail auto-fuel margin contractions when crude exceeds $90 per barrel, domestic upstream explorers demonstrate divergent balance-sheet sensitivity.
In a research note published by Kotak Securities, analysts raised their average FY27 crude expectation to $100 per barrel, noting that upstream state-run producers such as Oil and Natural Gas Corporation (ONGC) and Oil India retain solid dividend support and expanding earnings leverage during periods of elevated crude realisations. Conversely, broader sectors listed on the Indian market indices dashboard—predominantly specialty chemicals, logistics, aviation, and paints—must manage escalating raw material basket costs unless crude establishes stability near baseline projections.
FPI Allocation Trends and Foreign Exchange Pressures
Foreign Portfolio Investors (FPIs) track crude oil as a primary macro determinant for India’s Current Account Deficit (CAD) and currency stability. Because India imports over 85% of its crude requirements, persistent price levels above $110 per barrel increase sovereign import bills, placing depreciating pressure on the Indian Rupee against the US Dollar.
Market reports from Livemint detail that institutional participants are actively monitoring eight key inflection triggers, with energy security and institutional equity outflows at the top of the risk register. Data from Moneycontrol indicates that while India continues to source discounted Russian grades alongside Middle Eastern blends to optimize refinery throughput, sustained geopolitical friction reduces discount margins, impacting overall landing costs.
Primary equity fundraising continues alongside secondary market volatility. Market participants assessing new listings via the live IPO calendar and primary market schedule and monitoring recent debuts via the recent IPO listing performance tracker will note that institutional anchor book commitments often moderate during extended commodity price spikes.
Q2 FY27 Earnings Season: Sectoral Dispersion
The ongoing September-quarter (Q2 FY27) results season serves as the secondary core pillar steering domestic equity sentiment. Corporate filings submitted to BSE India and NSE India highlight divergent margin trends:
- Energy & Upstream Exploration: Companies benefit from strong crude realizations, sustaining EBITDA expansion despite domestic windfall tax adjustments.
- Banking, Financial Services, and Insurance (BFSI): Credit growth remains supported by domestic capital expenditure, though elevated cost of funds continues to compress net interest margins (NIMs).
- Consumer Durables & Industrials: Input inflation across petroleum-derivative chemicals and packaging materials presents a near-term headwind to operating margins unless passing price revisions through to consumers.
Balanced Investor Framework: Growth triggers vs Downside Risks
Market Growth triggers (The Bull Case)
- Domestic Institutional Absorption: Systematic Investment Plan (SIP) inflows from domestic retail and mutual fund portfolios provide continuous liquidity to offset foreign institutional selling.
- Refining Flexibility: India’s operational agility in processing diverse crude grades helps domestic refiners maintain stable processing margins relative to international peers.
- Earnings Resilience: Mid-cap and large-cap infrastructure and capital goods providers exhibit strong order books, mitigating commodity cycle vulnerabilities.
Market Vulnerabilities (The Bear Case)
- Sustained Crude Above $110: Long-term persistence at current price levels could elevate domestic retail inflation, restricting the Reserve Bank of India’s monetary policy room.
- Currency Volatility: Elevated dollar-denominated import payments may weigh on the foreign exchange reserves, reinforcing risk-off positioning among overseas institutional desks.
- Midterm Political Volatility: Shifting regulatory signals and geopolitical friction abroad may introduce further headline turbulence into global asset classes.
What to Check Before Rebalancing Portfolios
- Evaluate company-level raw material sensitivity to crude oil derivatives (such as solvents, resins, and carbon black) across manufacturing holdings.
- Track official exchange filings on BSE India and NSE India for Q2 FY27 gross margin commentary.
- Monitor foreign institutional net purchase data published daily by the clearing corporations to track institutional liquidity directions.
- Review debt-to-equity ratios and working capital debt cycles of energy-intensive businesses during periods of rising interest rates.
Frequently Asked Questions
How does crude oil at $118 per barrel affect the Indian economy?
Because India imports over 85% of its crude oil requirements, prices above $110 per barrel expand the national import bill, broaden the current account deficit, and increase input costs for energy-dependent industries. This dynamic can also add depreciating pressure on the rupee against foreign reserve currencies.
Why do upstream oil producers benefit while downstream refiners face margin pressure?
Upstream companies like ONGC extract and sell crude at market-linked prices, which directly increases their revenue per barrel produced. In contrast, downstream oil marketing companies often experience compressed marketing margins if retail fuel pump prices are kept unchanged while raw crude input purchase costs rise.
What factors should investors monitor during the ongoing Q2 FY27 earnings season?
Investors should examine operating margin sustainability, commentary on input cost pass-through capabilities, and management guidance regarding demand trends amid elevated global interest rates and geopolitical uncertainties.
SEBI Compliance & Statutory Disclaimer
The information and analysis presented on IPO Bulletin (ipobulletin.com) are for informational and educational purposes only and do not constitute financial, investment, or legal advice. Securities market investments are subject to market risks; please read all offer documents (DRHP/RHP) thoroughly before committing capital. Grey Market Premium (GMP) figures are unofficial, unregulated street estimates. Always consult a SEBI-registered investment advisor before making financial decisions.
Sources referenced: Moneycontrol, Livemint, The Economic Times, Kotak Securities research reports, BSE India, and NSE India filings.
Reusing this article or its images? Credit IPO Bulletin and link to https://ipobulletin.com/news/crude-oil-tops-rising-energy/. Content licence.