

MUMBAI, OCTOBER 24, 2026 — Data compiled from ACE Equity on Saturday, October 24, 2026, reveals sustained selling pressure across Indian equities, with 123 constituents of the BSE 500 index falling in each of the past five consecutive trading sessions. Among these continuous decliners, an identified group of 13 stocks witnessed severe drawdowns between 15% and 25% over the five-day trading span.
Key Takeaways at a Glance
- Broad-Based Weakness: Approximately 123 companies in the BSE 500 index recorded negative daily returns across five consecutive trading sessions.
- Severe Drawdowns: A focused subset of 13 equities registered steep corrections ranging between 15% and 25% during this five-session decline.
- Tracking Data: The market performance metrics were highlighted via ACE Equity screening on Saturday, October 24, 2026.
BSE 500 Market Sell-Off
NSE: BSE
▼ ₹34.20 (-1.05%)
Day Range: ₹3,190.00 – ₹3,290.40
52W Range: ₹2,326.10 – ₹4,446.80
● Real-Time Feed
Consecutive Decline Screening Timeline & Milestone Data
Institutional screeners track multi-session losing streaks to identify momentum exhaustion and systemic risk in broader market gauges. The data captured on Saturday, October 24, 2026, reflects trading pressure accumulated during the preceding market sessions on the BSE.
| Milestone / triggers Event | Confirmed Calendar Date |
|---|---|
| Historical 5-Session Small-Cap Drawdown Screening | March 28, 2026 |
| Secondary Market Extended Selling Window Tracked | May 23, 2026 |
| ACE Equity BSE 500 Consecutive Losers Report Print | October 24, 2026 |
BSE 500 Consecutive Losses: Market Breakdown
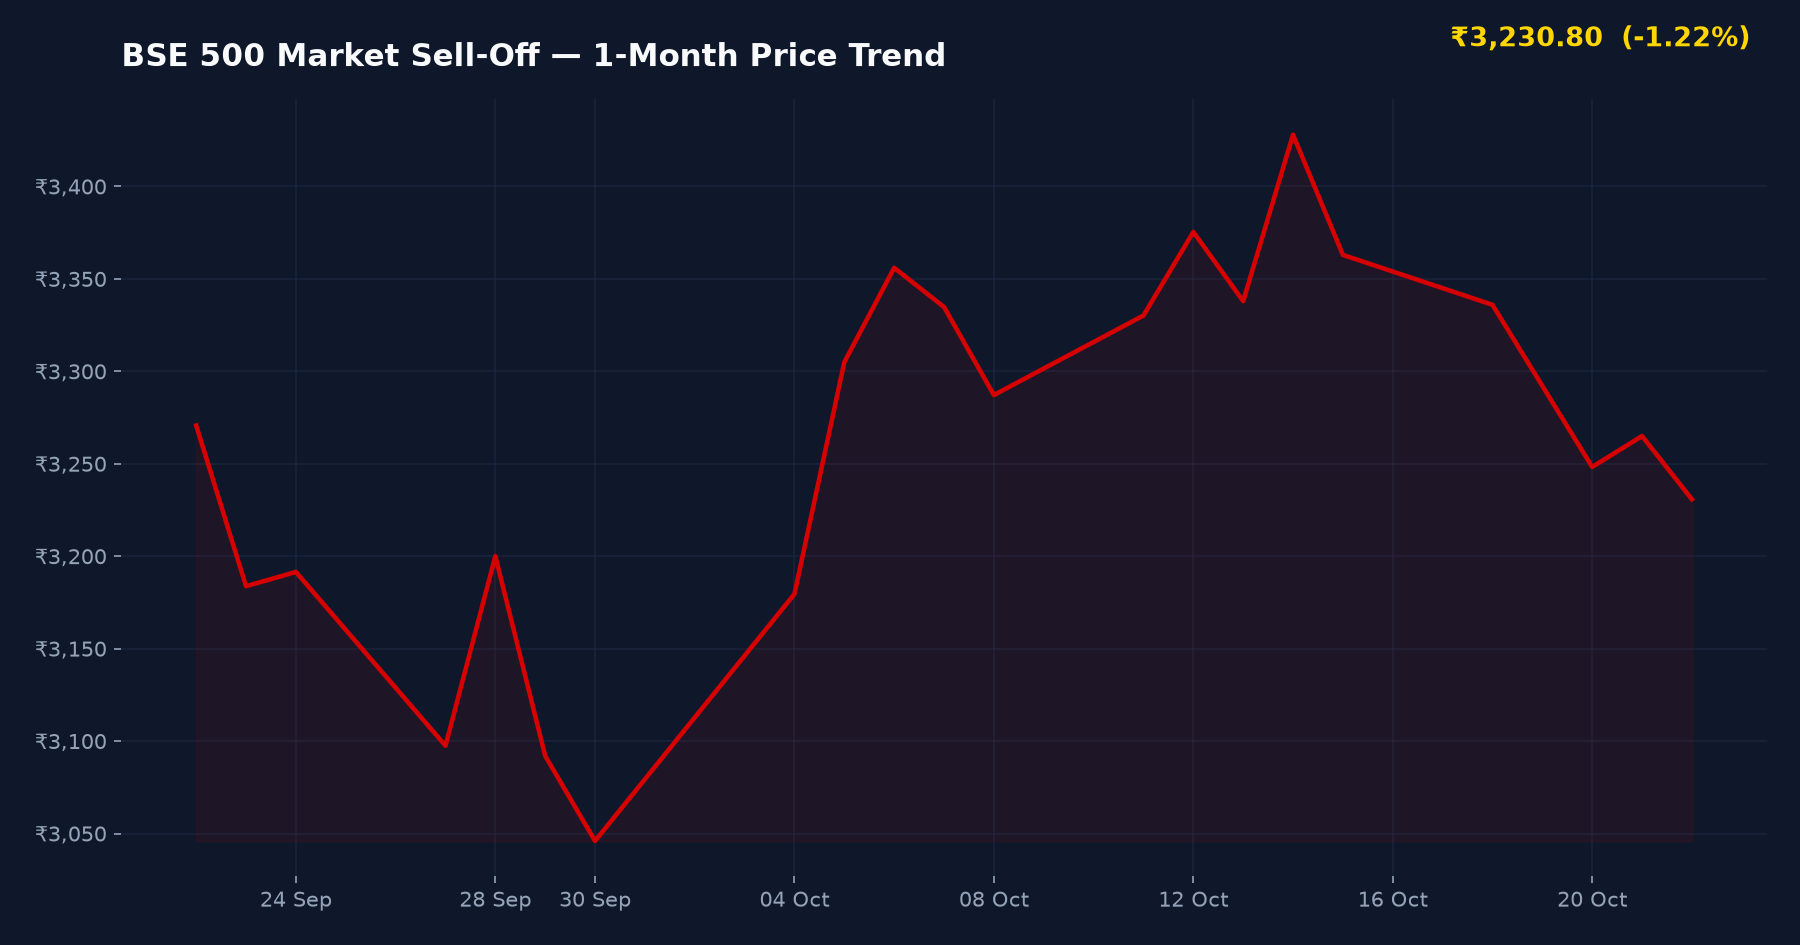
When tracking equity health via the Indian market indices dashboard, successive multi-session sell-offs often indicate sector rotation, institutional offloading, or macro headwinds. According to data tracked via ACE Equity, selling was not confined to marginal counters; rather, broad participation across the BSE 500 led to 123 individual counters failing to log a single positive session across the five-day period.
| Market Screener Metric | Screening Output |
|---|---|
| Benchmark Universe Evaluated | BSE 500 |
| Number of Stocks Declining 5 Straight Sessions | 123 |
| Subset of Severe Consecutive Losers | 13 |
| Five-Session Drawdown Range for Identified 13 Stocks | 15% to 25% |
What Drove the 15% to 25% Slide in 13 Counters?
A continuous price contraction over five straight sessions signifies persistent institutional and retail supply outstripping demand on the exchanges. Historical screening data published by The Economic Times highlights periodic phases where mid-cap and small-cap segments experience similar synchronized drops, such as the drawdown tracked on March 28, 2026.
Market participants reviewing broader sentiment across the recent IPO listing performance tracker and secondary equities observe that when 123 constituent companies decline simultaneously for a full week, broader market liquidity tightens. The sharp 15% to 25% erosion in the worst-hit 13 equities reflects technical breakdown triggers, stop-loss triggers, and portfolio derisking.
Market triggers vs. Downside Pressures
- Potential Technical Mean Reversion: Equities experiencing five consecutive down sessions with losses reaching up to 25% frequently enter technically oversold territory, which can attract value-driven accumulation if fundamentals remain sound.
- Valuation Compression: Corrective phases recalibrate elevated price-to-earnings multiples, aligning equity prices more closely with verified earnings performance reported in exchange filings.
- Liquidity & Delivery Pressure: Sustained supply without intermediate price bounces indicates institutional selling or unwinding of leveraged positions, posing near-term risks of further capitulation.
- Broader Breadth Deterioration: With 123 of 500 benchmark stocks declining consistently, negative market breadth often spills over into primary market pricing and dampens participation across the live IPO calendar and primary market schedule.
What to Check When Evaluating Consecutive Losers
- Examine quarterly financial filings submitted directly to the BSE India and NSE India to confirm whether earnings misses drove the sell-off.
- Check delivery volumes versus speculative intraday turnover to differentiate between institutional distribution and transient trading volatility.
- Review debt-to-equity ratios and pledged promoter holdings, which often exacerbate selling during broader equity corrections.
Frequently Asked Questions
What does five consecutive sessions of stock declines indicate?
Five consecutive sessions of negative closes indicate persistent selling pressure where daily supply consistently outmatches demand. While this technical pattern highlights severe short-term momentum weakness, it also pushes counters toward oversold metrics, depending on the underlying fundamental quality of each firm.
How many BSE 500 stocks declined for five straight sessions?
According to market screening data sourced from ACE Equity on October 24, 2026, a total of 123 stocks in the BSE 500 index declined in each of the five consecutive sessions. Of those 123 counters, 13 specific stocks recorded cumulative five-session losses between 15% and 25%.
Where should investors verify regulatory filings for declining stocks?
Investors should verify official corporate announcements, financial statements, and shareholding patterns on primary exchange portals such as the BSE India website and NSE India. Regulatory filings clarify whether price drops stem from company-specific material events or systemic secondary market trends.
SEBI Compliance & Statutory Disclaimer
The information and analysis presented on IPO Bulletin (ipobulletin.com) are for informational and educational purposes only and do not constitute financial, investment, or legal advice. Securities market investments are subject to market risks; please read all offer documents (DRHP/RHP) thoroughly before committing capital. Grey Market Premium (GMP) figures are unofficial, unregulated street estimates. Always consult a SEBI-registered investment advisor before making financial decisions.
Sources referenced: ACE Equity, The Economic Times, BSE India filings.
Reusing this article or its images? Credit IPO Bulletin and link to https://ipobulletin.com/2026/10/bse-market-sell-off-equities-slump.html. Content licence.