
MUMBAI / NEW DELHI, SEPTEMBER 29, 2026 — During trading on Tuesday, September 29, 2026, the Nifty 50 concluded its worst September derivatives series in 25 years, tumbling 6.3% to 6.7% over the month and breaching its crucial 200-week moving average. According to market data and reports published by Livemint and institutional desks on Tuesday, September 29, 2026, sustained foreign institutional investor (FII) selling, elevated crude oil prices, a weakening rupee, and rising bond yields heavily pressured domestic equities. Analysts tracking technical indicators note that the index is currently testing vital long-held support thresholds as market participants evaluate near-term technical reversals.
| Market Catalyst / Event Milestone | Exact Calendar Date |
|---|---|
| September Series Derivatives Expiry & Monthly Close | September 29, 2026 |
| Upcoming October Series Opening Trade | September 30, 2026 |
NIFTY 50
INDEX
▼ ₹424.30 (-1.83%)
Day Range: ₹22,569.65 – ₹22,753.25
52W Range: ₹22,182.55 – ₹26,373.20
● Real-Time Feed
Key Macroeconomic Drivers Behind the September Sell-Off
The sharp contraction in Indian benchmark indices during September 2026 stems from a convergence of domestic and global headwinds. According to updates released on Tuesday, September 29, 2026, across financial publications including Livemint, the Nifty 50 is down 13.5% across calendar year 2026, marking its worst yearly trajectory in 15 years. Persistent capital outflows by foreign institutional investors, driven by attractive yields in Western debt markets and geopolitical uncertainties impacting crude oil supply chains, have severely constrained market liquidity.
Furthermore, technical analysts monitoring price action on Tuesday, September 29, 2026, highlighted that breaking below the psychological 23,000 threshold has triggered cascading stop-losses across leveraged retail and HNI positions. Sector reports compiled by brokerages suggest that banking, IT, and auto heavyweights faced intense selling pressure throughout the monthly settlement cycle.
Technical Outlook and Support Levels for October 2026
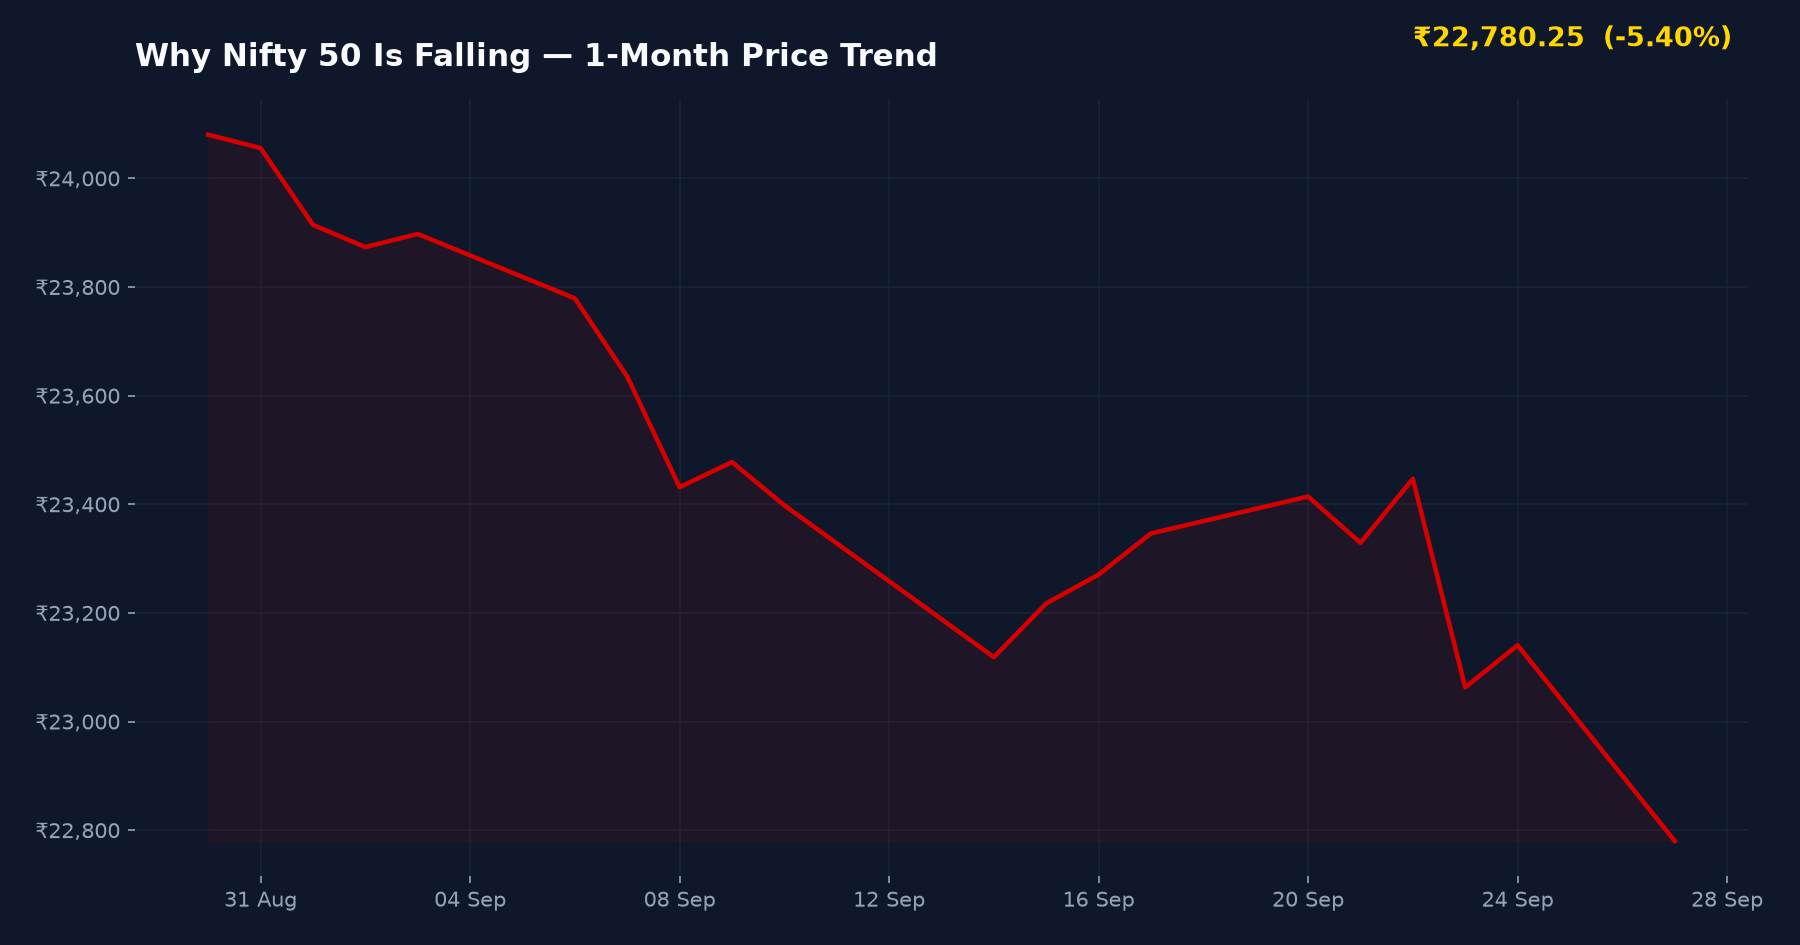
Despite the severe monthly drawdown, chartists observing intraday price action on Tuesday, September 29, 2026, identified nascent technical patterns that could dictate near-term direction. Reports from Livemint point out that a hammer formation spotted during late trade sessions hints at a potential short-term trend reversal heading into the October series opening on Wednesday, September 30, 2026.
Market participants are closely monitoring support bands near 22,600 and psychological markers around 21,000 should macroeconomic pressures persist. Conversely, overhead resistance remains stiff near immediate moving averages as institutional traders await corporate earnings updates and global macroeconomic data releases.
Bullish Catalysts vs. Bearish Risks
- Bullish Catalysts: Potential short-term technical bounce following hammer formations; resilient domestic retail SIP inflows providing structural market depth; expectations of robust Q2 corporate earnings recovery in select sector leaders.
- Bearish Risks: Continuous foreign institutional capital outflows; elevated crude oil price volatility; macroeconomic weakness triggering deeper support breaches below 22,600.
What to check before trading or investing
- Verify immediate support and resistance levels across major index constituents before executing derivative trades.
- Monitor institutional FII and DII cash market activity data published daily by the exchanges.
- Evaluate portfolio asset allocation and risk parameters in light of heightened market volatility.
Frequently Asked Questions
What triggered the sharp sell-off in the Nifty 50 during September 2026?
The September sell-off was driven by persistent foreign institutional selling, elevated crude oil prices, a weakening Indian rupee, rising bond yields, and heavy derivatives liquidation leading up to the monthly expiry on September 29, 2026.
What are the critical support levels to watch for Nifty in October 2026?
Technical analysts and market reports from Livemint identify crucial support zones around 22,600, with further potential downside targets near 21,000 if macroeconomic headwinds and selling pressure continue.
Is there any sign of a trend reversal following the September market crash?
Market reports on September 29, 2026, highlighted hammer candlestick formations on intraday charts, suggesting the possibility of a short-term trend reversal or technical relief rally as the October derivatives series commences.
SEBI Compliance & Statutory Disclaimer
The information and analysis presented on IPO Bulletin (ipobulletin.com) are for informational and educational purposes only and do not constitute financial, investment, or legal advice. Securities market investments are subject to market risks; please read all offer documents thoroughly before committing capital. Always consult a SEBI-registered investment advisor before making financial decisions.
Sources referenced: Livemint, Economic Times Markets Feed, BSE India filings
Reusing this article or its images? Credit IPO Bulletin and link to https://ipobulletin.com/2026/09/why-nifty-50-is-falling-september-sell-off-trigger-support-levels.html. Content licence.